A visual analytics workflow for investigating customers’ transactions in convenience stores
Ivana Kocanova, Muhammad Adnan, Georgios Aivaliotis, Roy Ruddle - University of Leeds
This research aims to enhance the analysis of customer’s shopping behaviour and provide new insights into the motivations behind customers shopping trips by combining novel data mining and visualisation techniques.
"What products do our customers buy together?" is a common question that retailers want to answer because it provides them with insights about customers’ shopping behaviour that underpin strategic investments. However, extracting such information is often a challenging task due to the complexity of the data.
This project investigates how novel data mining and visualization techniques can speed up the analysis of shopping behaviour and proposes a visual analytics workflow for investigating customers’ transactions.
Project aims
The work was conducted with a major retailer. Our contributions are:
(a) describing a visual analytics workflow that combines multiple event mining methods and visualization to analyse large-scale event data
(b) evaluating the workflow with real-world data.
Explaining the science
Efficient algorithms, for discovering relationships among the products present in the transactions, are crucial for understanding shopping behaviour. The dataset used contained 140,986 unique product combinations in 365,756 transactions. The high number of unique transactions is the reason why insight discovery is such a complex task in a retail setting. Consequently, we aim to simplify the transactions by dividing them into smaller, more manageable building blocks.
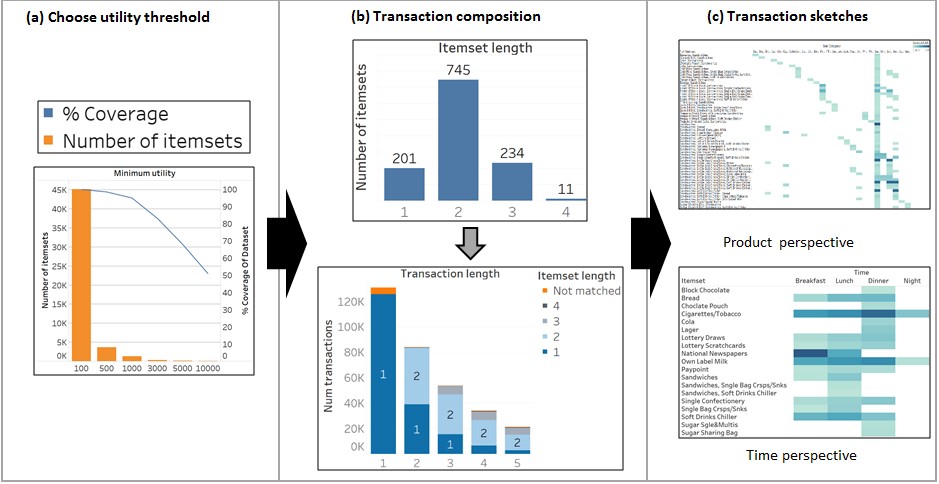
High Utility Itemset Mining (HUIM) searches for recurring product combinations that customers place in their shopping baskets. Since HUIM could produce for a dataset with m unique products as many as 2^m-1 unique combinations of products (itemsets), some sort of user-specified utility threshold is usually required. The threshold represents a trade-off between the number of itemsets and the percentage of the dataset that is covered by those itemsets.
Results
By using itemsets as building blocks of transactions we have shown that the complexity of the data can be significantly reduced. Setting the utility threshold to 1068, enabled us to cover 95% of transactions with only 1191 itemsets. This presents 100-times reduction in the number of unique patterns.
Having obtained the itemsets, a user may visually investigate the composition of transactions and create various transaction sketches. The sketches analyse the transactions from the product perspective (e.g. what products are often bought together), but also from a time-perspective (e.g. what products are bought at the particular time of the day).
Applications
Understanding interrelations among products could be leveraged by retailers in numerous ways. Particularly in convenience stores. Here the space for products are limited, therefore it is important to select a range of products which satisfies the majority of the customer needs.
Related to that is also a store layout which is heavily influenced by the product interactions.
Funders / Partners
This research was conducted as part of the QuantiCode research project, an EPSRC Impact Accelerator Award, and the intern programme in the Leeds Institute for Data Analytics. The research is funded by the Engineering and Physical Sciences Research Council, supported by the Medical Research Council and the Economic and Social Research Council.