An area classification of consumer vulnerability in the UK
Introduction
Some consumers are more vulnerable to marketing practices due to their personal traits such as age, health or household arrangements. For this study consumer vulnerability is defined as the risk that a consumer’s mental, physical or financial welfare may be damaged when engaging in a market interaction.
While consumer vulnerability has been discussed at length in academic literature and regulatory guidelines, there has not been a comprehensive geographical assessment of consumer vulnerability in the United Kingdom. This study creates a geodemographic classification of consumer vulnerability at output area level.
Data and methods
The variables selected to use for clustering were derived from 2011 Census outputs, based on the whether they suitably describe consumer vulnerability as defined above. In addition data from a commercial partner was used for cluster validation.
Highly correlated variables were considered for removal from the initial selection. Counts were converted to percentages for each output area. Data were then transformed using Inverse Hyperbolic Sine and standardised using z-scores. Principal component analysis was performed on the treated data before clustering.
K-means was performed to cluster the data using the first 10 principal components as inputs. The optimum number of clusters was first determined by running k-means at each value of k (number of clusters) from 2 to 25. This was then used when creating the final clustering.
Key findings
An optimum number of 6 clusters was found using k-means. These clusters were visualised using heat maps and radial plots by comparing clusters to the z-scores of the original variables. Each of these clusters showed distinct characteristics related to consumer vulnerability.
The clusters were characterised as:
- Prosperous Professionals
- Well Established
- Students and Young Professionals
- On a Budget
- Vulnerable Communities
- Vulnerable Pensioners
These cluster results were presented on an interactive map for the United Kingdom, showing cluster membership of each output area (Fig 1). Pen portraits were also written to help end users understand the characteristics of each cluster.
A consumer dataset was used to validate the clusters, finding a good level of agreement. This involved comparing the cluster solution to key variables such as income, shop spend and holiday spend. In addition to validation this process also generated extra insight into the cluster characteristics, such as spending habits.
Additionally, each cluster was broken down into sub-clusters and characterised using the same methods as above. This produced further insight into the makeup of each of the clusters, further identifying areas with particular vulnerability to market practices.
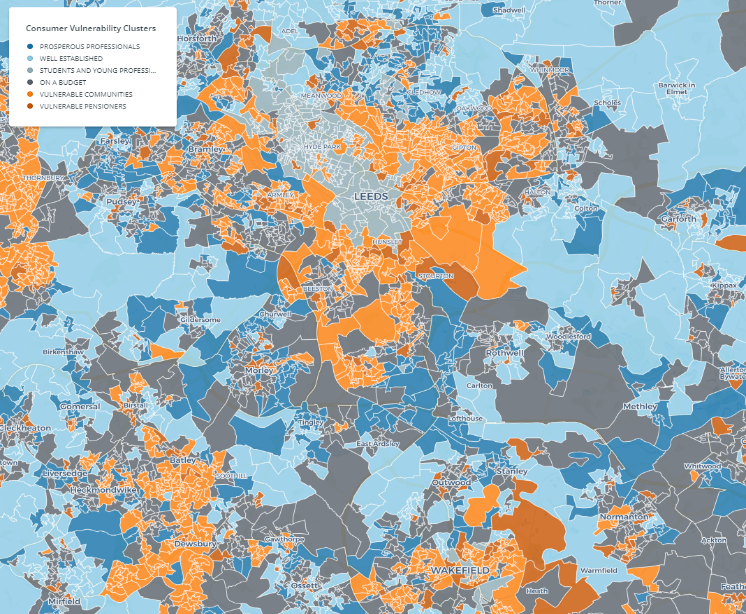
Figure 1: Map showing the cluster assignment for output areas in Leeds
Value of the research
By undertaking an assessment of the risk of consumer vulnerability at a fine spatial scale, policy-makers can identify where practices and policy may need to be adapted to avoid exploiting vulnerable individuals living in these areas. In addition, this work may be useful for identifying areas where consumers may benefit the most from services such as the Telephone Preference Service.
The framework developed in this work can also be applied to new data sources to answer questions relating to consumer characteristics at varying geographical scales.
Researchers
Michael Adcock, Data Science Intern, LIDA
Dr Nik Lomax, School of Geography and LIDA
Dr Stephen Clark, School of Geography and LIDA