Open access data for transport research: tools, modelling and simulation (OpenInfra)
OpenStreetMap data has the potential to transform how transport infrastructure planning is done, yet currently its application for (accessible) active travel infrastructure planning is restricted due to the lack of more refined information about highway attributes.
Project overview
Dependence on motorised modes of travel is associated with adverse physical, mental, and environmental health. Shifts to more sustainable and active modes, such as walking, wheeling, and cycling, can tackle these issues (Public Health England 2016). However, to encourage the uptake of active modes of travel, it is important to meet the infrastructural needs of all citizens. For example, Aldred, Woodcock, and Goodman (2016) found that a boost in cycling does not necessarily lead to an increase in diversity of cyclists. Therefore, it might be key to engage citizens from a variety of backgrounds in the planning process in order to incentivize a modal shift. A potential way to foster engagement is to encourage citizens to generate data about their local environments which, consequently, could be used to make interventions informed by both data and local contexts. Thus, this project aims to explore how open crowd-sourced data, specifically OpenStreetMap (OSM), can be used to understand, prioritise, and design active travel infrastructure1.
Data and methods
OSM data is open, thus free to use regardless of the purpose as long as the source is credited. To query OSM database, an osmextract package (Gilardi and Lovelace 2021) in R has been used. Three metropolitan counties - West Yorkshire, Greater Manchester, and Merseyside - and an administrative area - Greater London - have been chosen as case studies for the first 6 months of the project with a goal to scale it up to the entire England in months 7-12.
It is important to understand the data structure of OSM in order to utilize it. Essentially, OSM data is composed of three key elements: nodes, ways, and relations. To describe geographic features, tags, or key=value pairs, are utilized. For more in-depth information on OSM data structure, read an introductory article written on the subject as part of the project.
To explore OSM data, exploratory data analysis (EDA) was applied (see Beecham and Lovelace 2022). EDA was used to understand the potential and limitations of the OSM data. Bar charts have been chosen as a visual tool to demonstrate the presence/absence of data. In particular, bar charts in this report are used to demonstrate the proportions of (some of) the tags relevant to active transport research to all the mapped highways in a given case study2. The size of data per area can be seen in Table 1. It is important to note that OSM data is constantly being updated, hence the size of data might fluctuate depending on when it was downloaded. Finally, values in Figure 2 have been recategorized to minimize the number of bins and, thus, improve the readability of the bar plots3.
Key findings
The analysis has shown that highway=footway and highway=cycleway tags constitute about 1/3 of all the mapped highways in OSM. Greater London stands out as the proportion reaches 1/2 mark (Figure 1). This is not surprising given that London boroughs and Transport for London received the largest allocation of active travel fund in 2020. Surprisingly, however, Greater Manchester has a very similar highway proportion to the other two metropolitan counties even though it has, in 2018, proposed an ambition to deliver the most comprehensive active travel network in the England (Transport for Greater Manchester 2018).
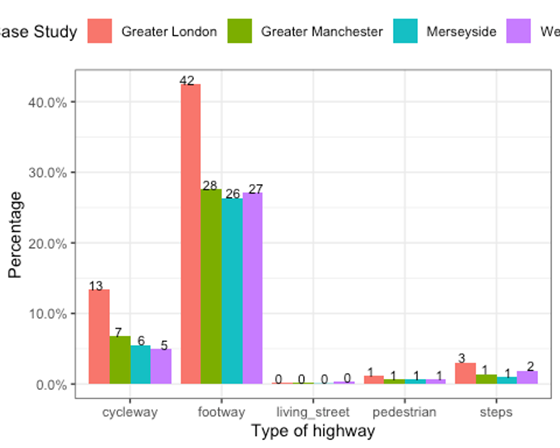
Figure 1: Proportions of different highway values in four case studies
Arguably the most important characteristic of OSM is not its ability to represent various types of highways but rather attributes about them. For example, it is possible to refine highway=cycleway tag by using cycleway to specify if it is a separate or shared cycleway. Similarly, a bicycle=* tag can be used to indicate if a highway, such as a footway, can also be cycled on. The variety of tags and possible values allow us to represent different elements of active travel infrastructure, such as shared spaces. Furthermore, footway=* tag can be used to indicate the presence of a sidewalk rather than a crossing (coded as “other” in Figure 2). Although these tags provide valuable information about active travel infrastructure, not every highway is refined. In the case of sidewalks, the lack of information has also been reported in Germany (Mobasheri et al. 2017), thus indicating that missing data is not confined to England only but, arguably, has been a characteristic of the OSM mapping practice up to now.
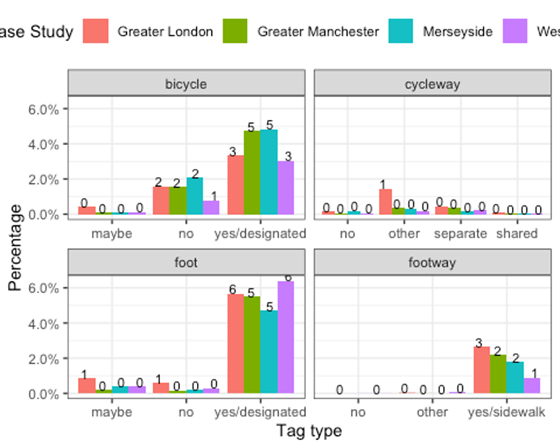
Figure 2: Proportions of (some) tags relevant to active travel infrastructure planning
Restricted information on sidewalks and their attributes reveals the current limitations of OSM’s potential to be utilized in planning accessible active travel infrastructure. Scarcity of data relevant to accessible planning can be exemplified via other tags, such as kerb or surface, too (see Figure 3). Nonetheless, in the future it might be possible to take full advantage of the OSM data to support the examination of accessibility as outlined in the Inclusive Mobility guide (2021). In other words, OSM data could be recategorized. This does not mean that all the intricacies of the requirements would be captured, but that it could, perhaps when joined with other (open) datasets too, be used to help to determine which streets are inclusive and which need to be prioritized for redesign. Some of this work has begun, namely writing a function in R, that returns recategorised OSM data. For instance, based on the footway (pavements adjacent to the road) and footpath (any other right of way that is not adjacent to road) definitions in the Inclusive Mobility guide (2021), about 1/4 of all the mapped highways could be classified as footpaths; yet only a small percentage (with the exception of Greater London) are footways . Moreover, given there is enough data, OSM data could be used to find out not only if the surface is paved or not but, more importantly for accessibility, if it is even or not and whether or not the kerb is flush for a wheelchair-friendly crossing.
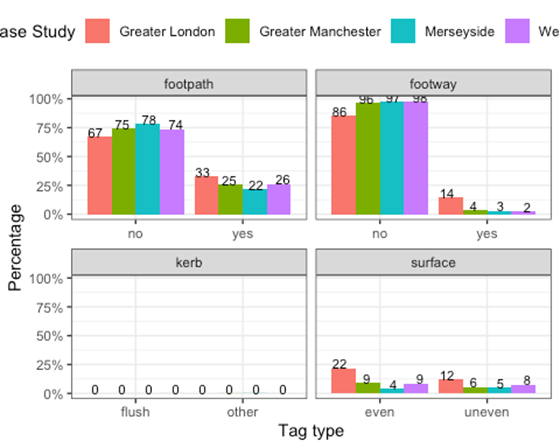
Figure 3:Recategorised OSM tags based on the Inclusive Mobility guide
Value of the Research
OpenInfra is a 12-month project, thus its actual impact is yet to be determined. Nevertheless, the project has already contributed to the empirical examination of OSM data, which has resulted in the accepted extended abstract. One of the key contributions of the project has been the consideration of OSM data from the perspective of accessibility, a central characteristic in designing cycling and pedestrian infrastructures (Department for Transport 2020, 2021).
Another output of the project is a website. The aim is to introduce OSM data, demonstrate how it can be downloaded and used in transport research in a manner that is understandable and accessible to everyone. So far, the content has attracted considerable attention on Twitter showing the need for such a project. The expectation is that it will encourage the adoption of OSM data in active travel infrastructure while taking into account its (current) limitations. Indeed, it is likely that a more nuanced understanding of OSM data and its potential applications and benefits could motivate more citizens to become mappers and more mappers to add data needed for accessible planning.
Finally, it should be emphasized that the project has a GitHub repository with an aim to promote reproducibility of research. The code related to the results and outputs is fully available (including the code behind this report), which can be used as an additional material to learn about processing and analyzing OSM data. Also, it is hoped that code availability will encourage researchers, citizens, and policy-makers, who are well-versed in programming, to engage with the research and even contribute to it by suggesting changes in the code.
Insights
Advantages of using OSM data in transport research:
• provides a (comprehensive?) active travel network;
• data structure and tags are flexible enough to represent cycling and walking infrastructures (e.g., cycle lanes and tracks, shared spaces);
• up-to-dateness;
• encourages citizen science and a bottom-up approach to planning;
Limitations:
• the more specific a highway attribute is, the less data there is;
• tag values lack homogeneity (e.g., width = -1 (!) in West Yorkshire, but also values 20cm, 2m, 1-1.5m);
• not straightforward to recategorize.
Research theme
Urban Analytics
People
Research team:
Greta Timaite, Data Scientist, University of Leeds
Robin Lovelace, Associate Professor of Transport Data Science, University of Leeds
Victoria Houlden, Lecturer in Urban Data Science, University of Leeds
Ed Manley, Professor of Urban Analytics, University of Leeds
Steering group:
Rachel Cookson, Ordnance Survey
Ben Taylor, Open Innovation Team, policy side
Brian Deegan, Transport Consultant
Dustin Carlino, A/B Street
Kit Allwinter, Active Travel in West Yorkshire Combined Authority
Graham Kirkby, Transport for the North
Kayley Vanlint, Department for Transport
Paul Downey, Transport for the North
Funder
This work was supported by the ESRC funded Consumer Data Research Centre (CDRC) under grant references ES/S007164/1 and ES/L011891/1.
Bibliography
Aldred, Rachel, James Woodcock, and Anna Goodman. 2016. “Does More Cycling Mean More Diversity in Cycling?” Transport Reviews 36 (1): 28–44. https://doi.org/10.1080/01441647.2015.1014451.
Beecham, Roger, and Robin Lovelace. 2022. “A Framework for Inserting Visually-Supported Inferences into Geographical Analysis Workflow: Application to Road Safety Research.” OSF Preprints. https://doi.org/10.31219/osf.io/mfja8.
Department for Transport. 2020. “Cycle Infrastructure Design (LTN 1/20).” The Stationery Office.
———. 2021. “Inclusive Mobility: A Guide to Best Practice on Access to Pedestrian and Transport Infrastructure.”
Gilardi, Andrea, and Robin Lovelace. 2021. “Osmextract: Download and Import Open Street Map Data Extracts. R Package Version 0.3.1.”
Mobasheri, Amin, Yeran Sun, Lukas Loos, and Ahmed Loai Ali. 2017. “Are Crowdsourced Datasets Suitable for Specialized Routing Services? Case Study of OpenStreetMap for Routing of People with Limited Mobility.” Sustainability 9 (6): 997. https://doi.org/10.3390/su9060997.
Public Health England. 2016. “Working Together to Promote Active Travel: A Briefing for Local Authorities.”
Transport for Greater Manchester. 2018. “Beelines: Greater Manchester’s Cycling and Walking Infrastructure Proposal.”