AuguR: a scalable open-source interactive cancer analytics web application for routinely collected data
Providing health care professionals and hospital managers with interactive analytics for cancer outcomes and waiting time data.
Project overview
Cancer data such as survival outcomes and waiting times are routinely collected across hospitals.
Whilst organisations such as NHS Digital and Public Health England analyse these data, their outputs can take years to produce and provide limited information at a local or regional level.
The aim of this project was to develop software that allows hospitals across Yorkshire and Humber to analyse and obtain immediate insight from their own cancer data.
This involved developing an interactive cancer analytics web application and an automated data analytics report.
Data and methods
A series of meetings were held where health care professionals and hospital managers suggested features and functionalities that they wanted to be included in the web application and automated report.
The web application was developed using the Shiny framework, which enables the building of interactive web applications directly from R code. This project built upon an existing prototype app, AuguR. The app, which will be deployed within a secure regional cloud environment, The Yorkshire Data Arc, works by aggregating routinely collected data and visualising it through an interactive dashboard.
The analytics report was created using R markdown. The report, which displays waiting time data, can be automatically updated, and emailed to key decision makers on a weekly basis.
Key findings
Web application:
The web application is made up of five tabs: Clinical Outcomes, Targets, Population Explorer, Geospatial and Treatment.
Clinical outcomes:
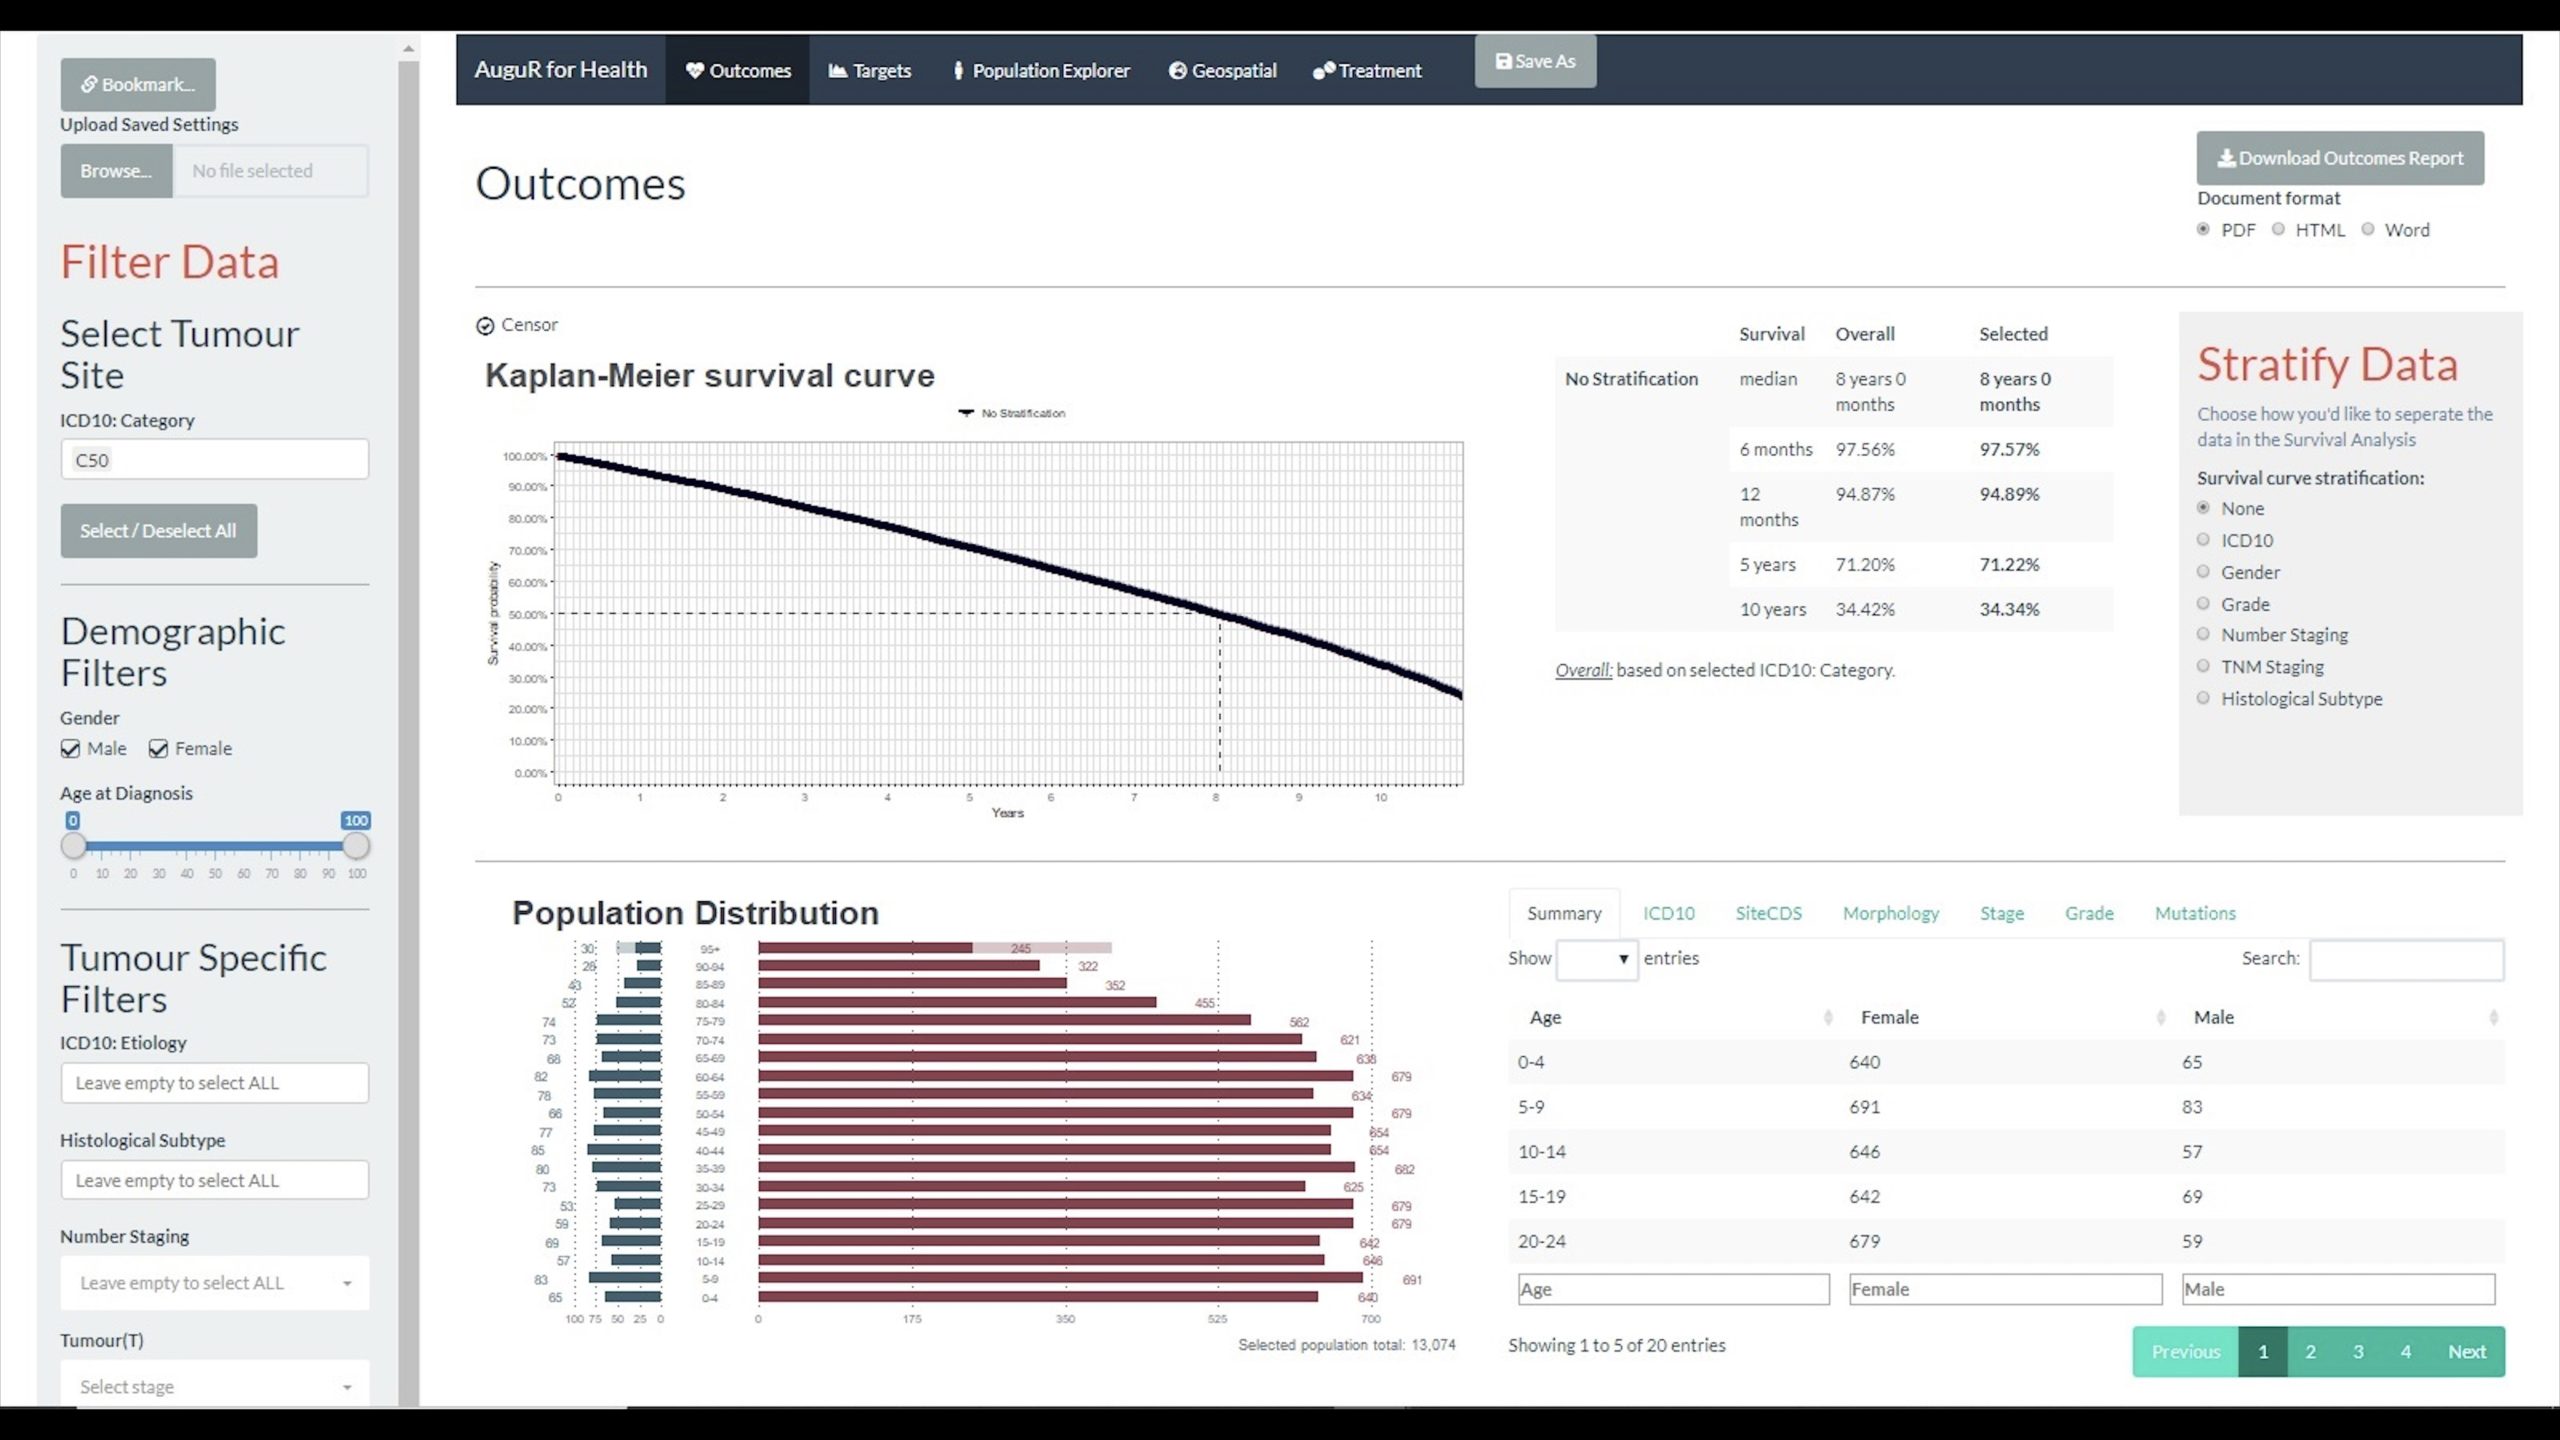
Figure 1: Screen shot of clinical outcomes tab for breast cancer patient data (C50). Image includes data filters, KM curve, population pyramid, case number summary table and comparative survival by time
The clinical outcomes tab has two key features: a Kaplan Meier survival curve and population pyramid. The demographic and tumour specific filters can be used to select a category of patient to look at. In Figure 1 breast cancer patients have been selected.
The population pyramid displays the structure of the patient population selected, while the survival analysis shows the percentage of patients that survived following diagnosis at different time intervals. The survival analysis can be stratified by characteristics like gender or cancer stage allowing the user to see how outcomes differ between different groups of patients.
Targets:
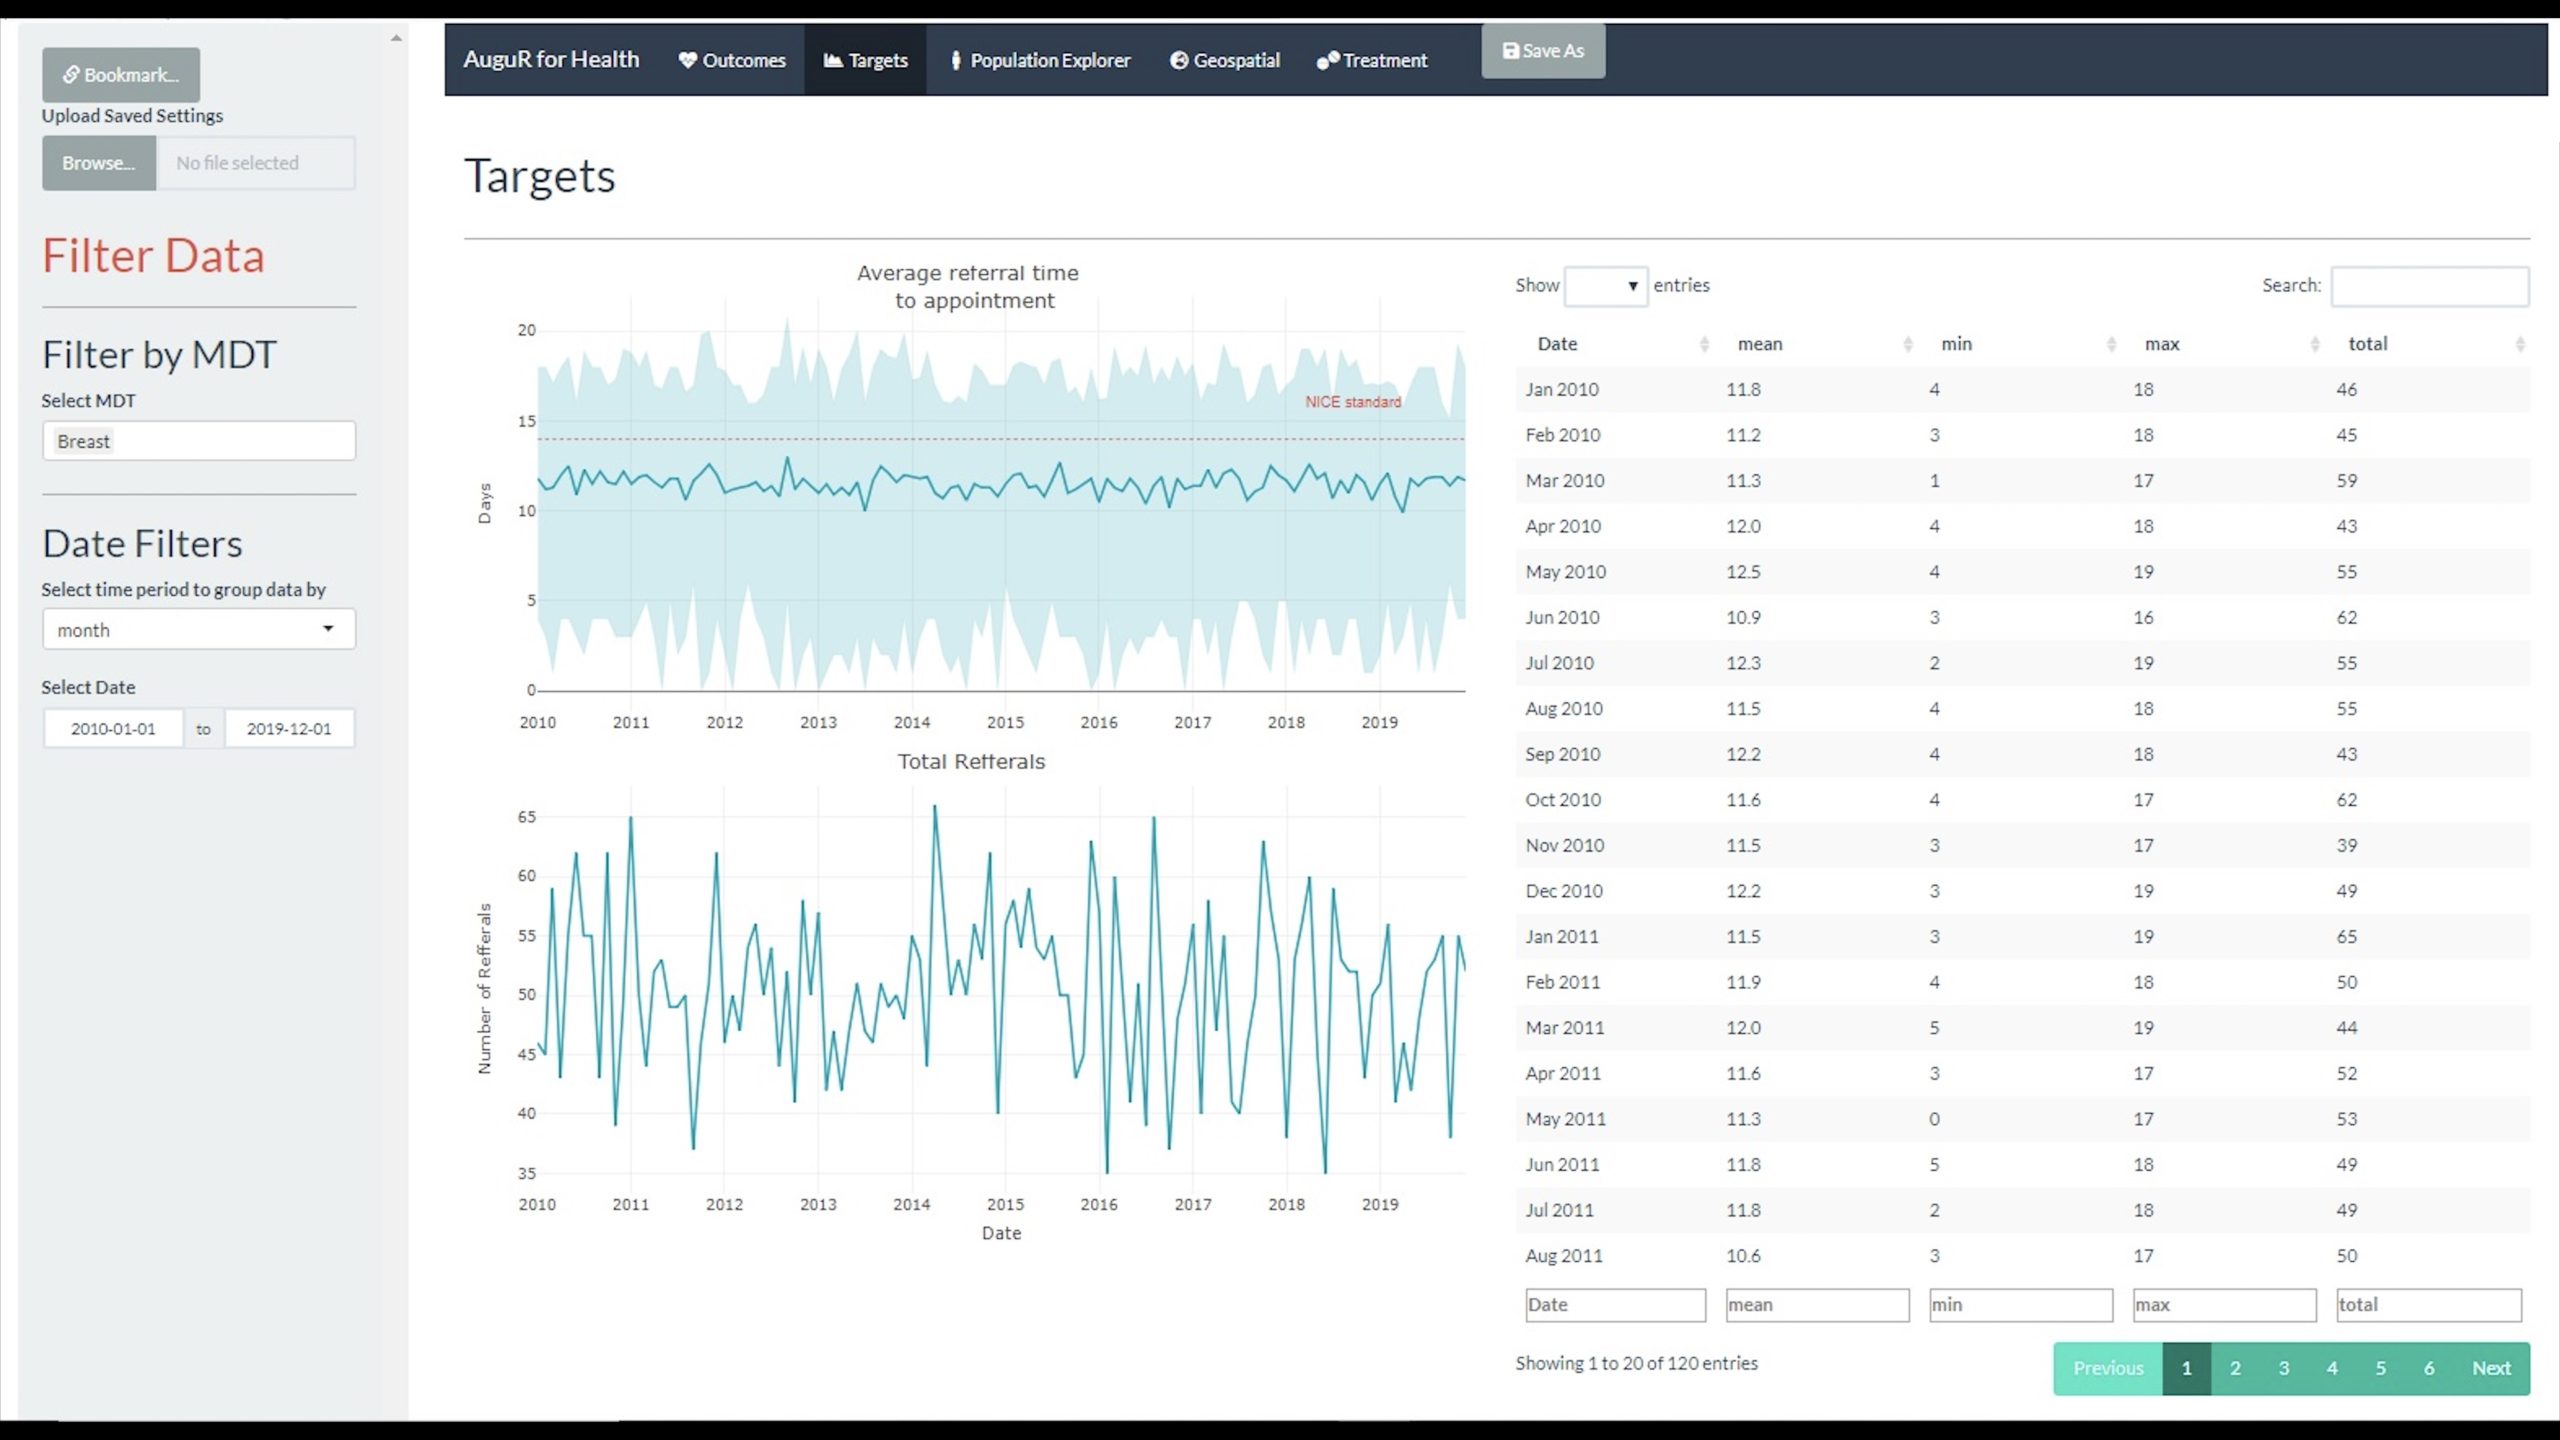
Figure 2: Screenshot of Targets tab which includes data filters, interactive waiting time plot, interactive referral volume plot and summary data table
The targets tab visualises waiting times data. It includes graphs showing the average time to be seen following a two week wait referral, and the number of these referrals made. The user can filter the data by multidisciplinary team and select a specific time period to look at.
Population Explorer:
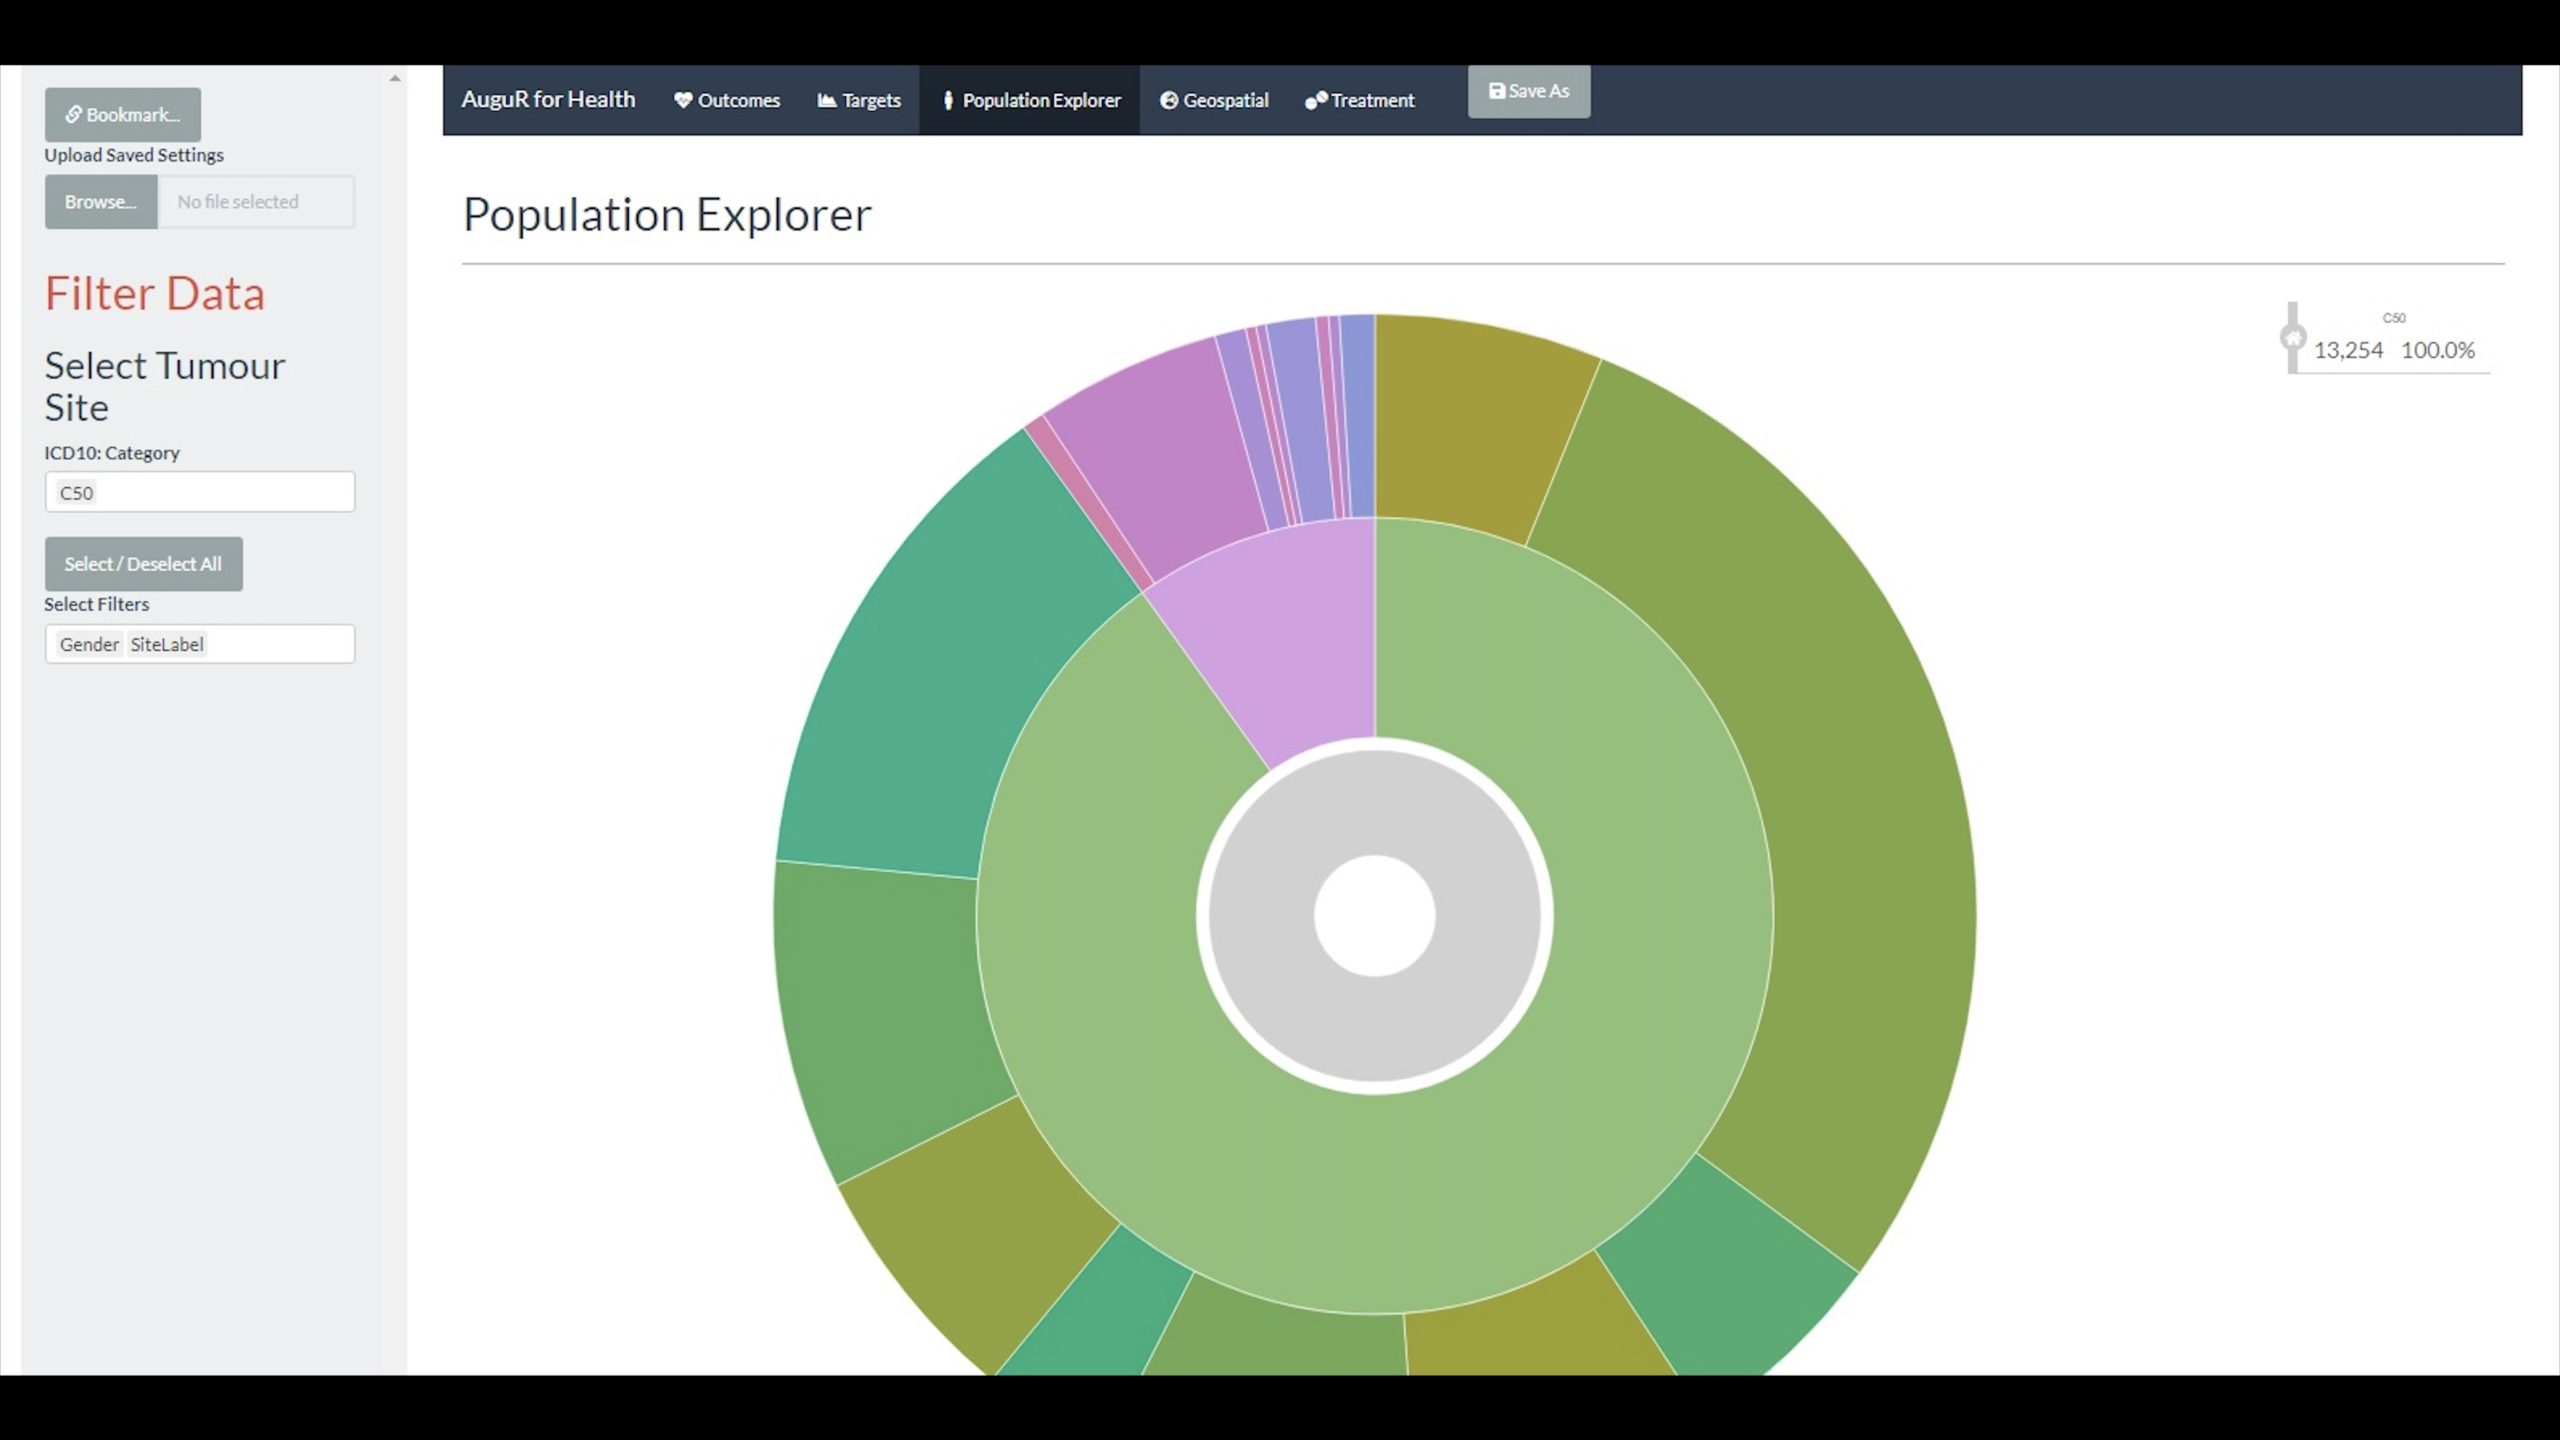
Figure 3: Screenshot of population explorer showing population of breast cancer patients broken down by gender and site.
The population explorer tab was developed as health care professionals and hospital managers wanted to be able to access information about patient numbers. How many female breast cancer patients are there, or stage 1 lung cancer patients? This type of information is needed for Freedom of information Act requests, business cases and when assessing trial feasibility.
We implemented a flexible population explorer which allows the user to start with any population of cancer patient and apply any order of filtering to the data.
Treatment Tab:
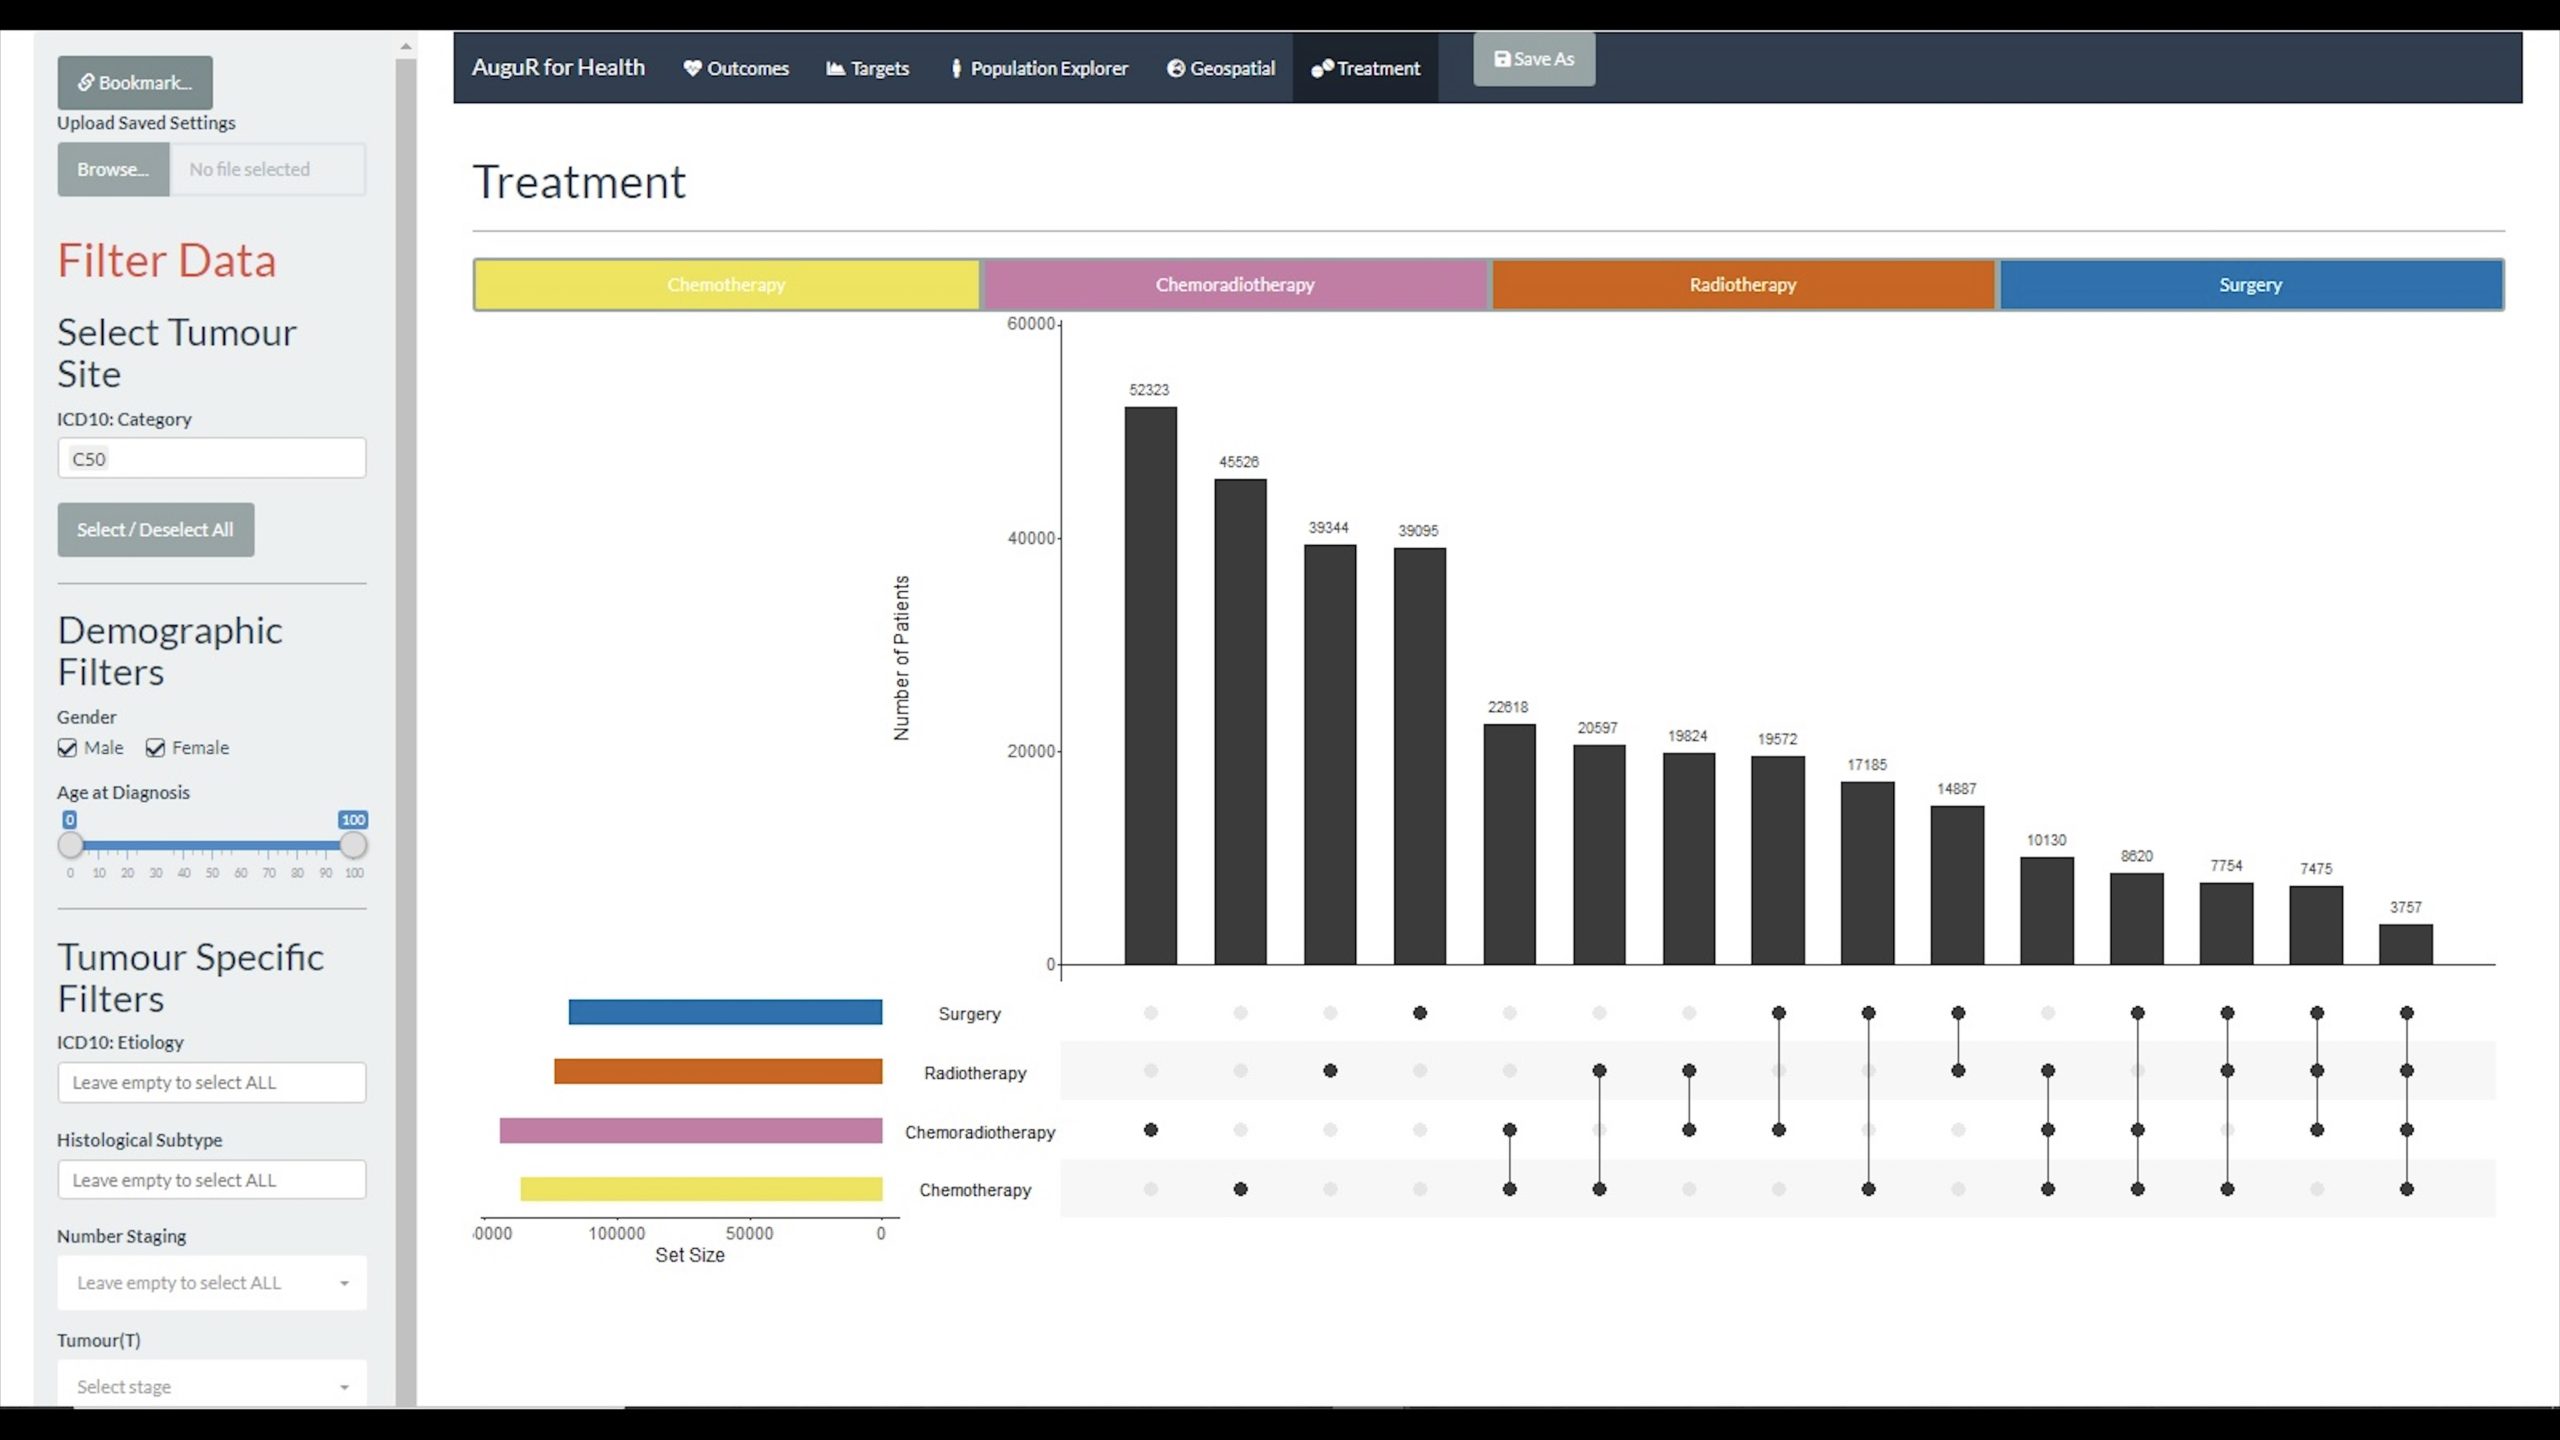
Figure 4: Treatment tab showing the number of patients who have received Chemotherapy, Chemoradiotherapy, Radiotherapy and Surgery and combinations of these treatments.
Currently, the treatment tab displays the number of patients who have received different types of treatments. The demographic and tumour specific filters can be used to select a specific category of patient the user wants to look at.
Automated data analytics report:
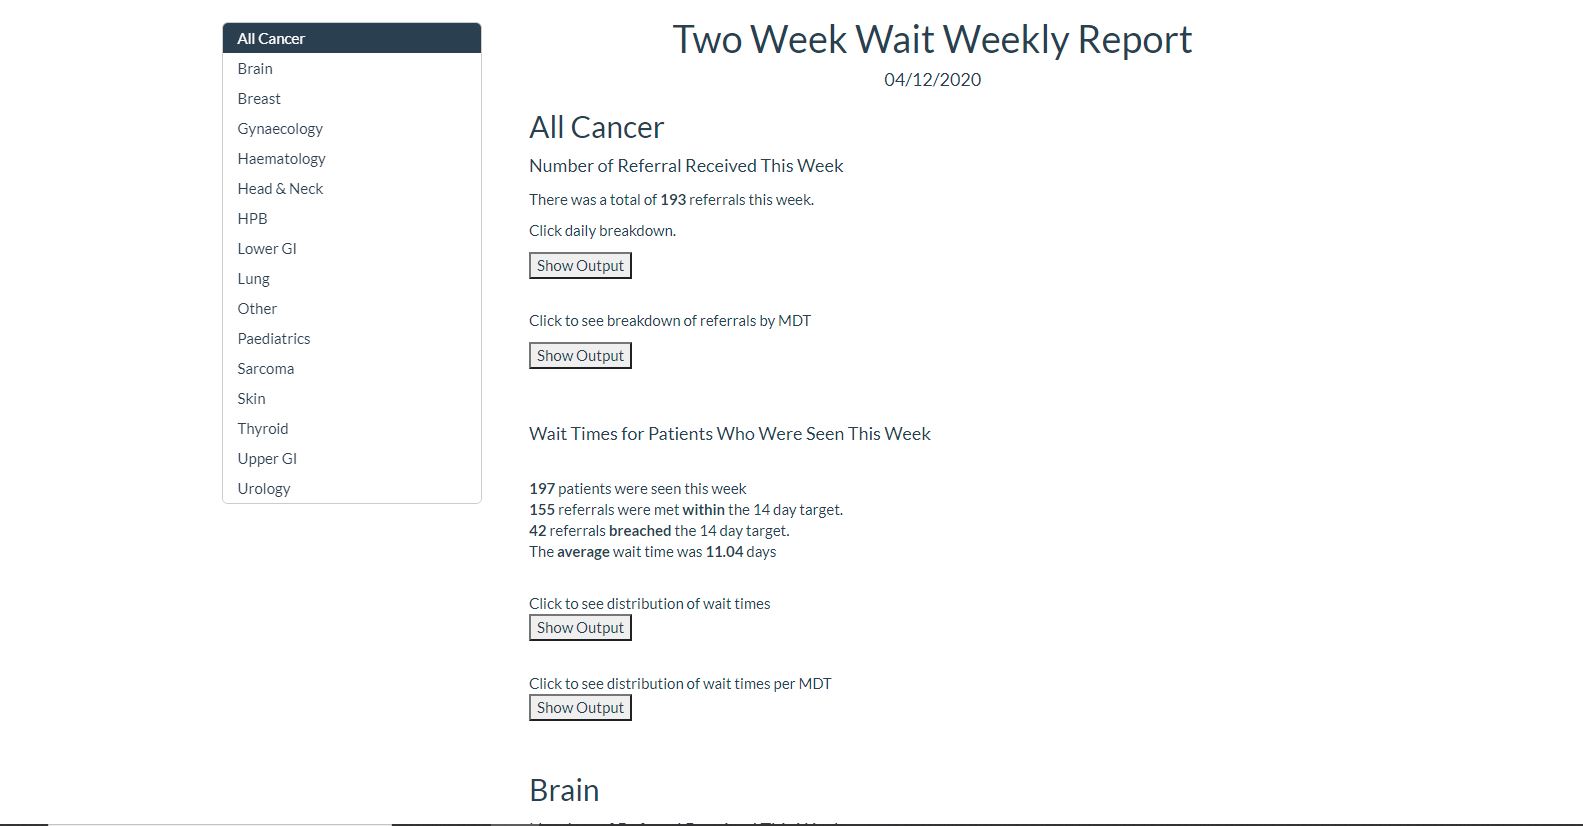
Figure 5: Extract from html based automated report for service demand and waiting times
Alongside the app we also created automated two week wait reports that can be emailed to key decision makers within the hospital each week. They contain graphs and summary statistics outlining the number of patients seen that week, number of referrals made, how many patients were seen within the 14-day target, and the average waiting time.
Value of the research
Overall, the app aims to enhance the utilisation of routinely collected cancer data within hospitals across The Yorkshire and Humber Region.
Being able to perform timely analysis at a more granular level may lead to a more accurate understanding of clinical outcomes and aid managerial oversite.
As the app is based on nationally collected datasets and uses open-source tools, there is potential for scaling deployment nationally, which could ultimately lead to the improvement of patient care nationwide.
Insights
- The easy-to-use app will allow health care professionals and hospital managers to interact with, analyse and export waiting time and outcome data, soon after they are collected.
- Alongside this, automated data reports can be emailed to key decision makers within hospitals at regular time intervals.
- Together, their outputs can aid managerial oversight and improve understanding of clinical outcomes
Research theme
Health Informatics
Partners
Leeds Teaching Hospitals NHS Trust, in partnership with the University of Leeds and Yorkshire and Humber Care Record
People
Millie Wagstaff – LIDA Data Science Intern
Dr Kieran Zucker - Clinical Research Fellow and Honorary Clinical Oncology Specialist Registrar
Prof Geoff Hall - Senior Lecturer in Medical Oncology and Cancer Informatics within the Leeds Institute of Cancer and Pathology
Dr Roger Beecham - Lecturer in Geographic Data Science
Funders
The Health Foundation