Can We Estimate Rock Strength from Rock Texture?
Sadiq Balogun, Dave Healy
University of Leeds
By mining decades of published rock mechanics paper and testing whether two simple measurements, grain size and porosity, can predict rock strength as accurately as more expensive and time-consuming laboratory analyses. This research could accelerate the global transition to clean energy. Project overview
Subsurface energy projects require engineers to know the strength of the rocks beneath the surface. This requires expensive laboratory rock mechanics testing that creates significant time and cost barriers for project development. This research project addresses these issues by tapping into existing rock strength data in published research papers and academic theses. We aim to:
- Develop a data mining tool that digitises differential and mean stress (Q-P) plots already available in research papers and theses and create a database to store these datasets for further analysis.
- To use these datasets to test the hypothesis that rock failure strength can be predicted using a function of the grain size and porosity.
Data and methods
The study focused on rock mechanics Q-P plots, which graphically represent the relationship between differential stress (Q) and mean stress (P) during rock failure testing. These plots are challenging for automatic extraction because: they often contain multiple datasets representing rock types within a single figure; the format of the plots in legacy papers is not clear; different authors and research teams use different formats for the plots
We attempted to use existing digitisation tools, including LineEX [1] and WebPlotDigitizer [2]. However, these solutions proved inadequate for the project’s requirements. The LineEX tool failed to achieve sufficient accuracy for the precision needed, while the WebPlotDigitizer was designed for a single dataset extraction, lacked database functionality for data management, and no validation step during extraction. Computer vision approaches using colour and shape segmentation techniques were also investigated. However, the heterogenous nature of the Q-P plots – varying in style, colour schemes, symbol types, and layout – would have required extensive training datasets and deep learning model development beyond the project’s time constraint.
Consequently, we developed a custom digitisation tool using Python and Streamlit framework. The custom digitisation tool successfully addressed the key limitations identified in existing solutions, incorporating features that significantly enhance the efficiency and data quality. The tool enables simultaneous extraction of multiple datasets from individual plots, reducing processing time, a visual validation system that overlays extracted data points on original plots, allowing immediate accuracy verification, a database for storing the digitised data that includes DOI as the identifier to avoid duplication, and a generative AI for natural language query of the database.
Using the developed tool, data were extracted from six Q-P plots: [3], [4], and [5]. This extraction process resulted in a comprehensive dataset comprising of thirteen different sandstone types, five limestones, and frictional data for both sandstone and limestone rocks. This totals into 267 data points. To extract the grain size values needed for testing the hypothesis outlined in the project’s second objective, we employed Google’s NotebookLM. This tool enabled efficient extraction of the grain size values from within the text of the research papers using natural language queries. The porosity and grain-size values were used to calculate the hydrostatic pressure (P*) using the equation below. This hydrostatic pressure was then employed to normalise the differential stress (Q) and mean stress (P) values, enabling clearer and more meaningful comparisons across the different rock types.
log(P∗) [MPa] = 0.625 − 1.064 ∗ log(porosity ∗ grain size)log(P∗) [MPa] = 0.625 − 1.064 ∗ log(porosity ∗ grain size)
Key findings
The accuracy of the developed tool was validated by recreating figure 8 from [3], which showed a remarkable accuracy. For example, the original publication reported slopes of the critical state line and the frictional failure envelope of 1.18 and 1.43, respectively. Following digitisation and statistical analysis, the extracted data yielded corresponding slope values of 1.25 and 1.37, with the original published values within our model’s confidence interval. This close correspondence between digitised and original slope values confirms the tool's capability to accurately extract quantitative data from complex multi-dataset plots while preserving the statistical relationships essential for hypothesis testing.

Figure 1. Reproduction of Rutter and Glover (2012) Figure 8 showing the critical-state slope and the frictional slope
By expanding the original dataset from [3] - from four sandstone samples to thirteen, with porosities ranging from 13% to 35%, we conducted a statistical test to determine if rock strength can be determined with grain size and porosity using the hydrostatic pressure equation The results show that the data points from all sandstone type tend to converge onto a single trendline, demonstrating universal behaviour across different sandstones.
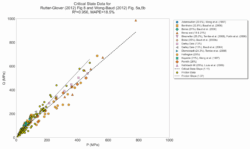
Figure 2. The critical state slope line and frictional slope line for the expanded sandstone dataset
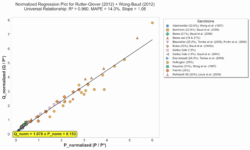
Figure 3. Regression plot of the normalised sandstone data
This method of determining rock strength was also investigated for limestones; however, no correlation was identified between the critical-state slope and the friction slope, indicating that the method is less suitable for these rocks.
Value of the research
This research delivers immediate and long-term benefits for energy transition by reducing the time and cost associated with estimating the strength of rocks. The relationship between rock strength, porosity, and grain size means engineers can now use a single prediction formula for any sandstone type – based on readily available grain size and porosity data – instead of developing separate models for each geological formation, eliminating the need for expensive laboratory tests and enabling immediate strength assessments using two simple measurements. Porosity and grain sizes can be measured from borehole cuttings or estimated from wireline logs. Quantification of rock strength by the new method could lead to order of magnitude reductions in cost and time and is especially relevant for the growing Carbon Capture and Storage (CCS) sector, where sandstone-hosted reservoirs are the key targets.
The digitisation tool provides the research community with capabilities previously unavailable in existing solutions, including simultaneous extraction of multiple rock datasets from individual plots, visual validation systems for quality control, and comprehensive database architecture with both SQL and natural language query interfaces. The systematic approach to metadata management ensures full traceability to source publications while preventing data duplication. The approach developed here could be adapted for other engineering and geological applications where legacy data extraction would accelerate research and development efforts.
Insights
- We've created a comprehensive digital extraction tool for rock mechanics data, building a database of digitised historical data.
- We have performed a statistical validation of the Rutter-Glover hypothesis.
- We've demonstrated that porosity and grain size can predict the strength of sandstones to a reasonable approximation
- We've also learned that this method of rock strength prediction works well for sandstones but fails for carbonate rocks like limestones, indicating the approach is rock-type specific.
Research theme
- Environment
Programme theme
- The Science of Data Science
- Artificial Intelligence
- Data Science Infrastructures
Team
Sadiq Balogun – Data Scientist, Leeds Institute for Data Analytics
Prof. Dave Healy – Director of Geosolutions, Professor of Geomechanics, School of Earth and Environment, University of Leeds
Funder
Funded by Geosolutions Leeds, part of the University of Leeds Climate Plan
This work has been facilitated by the Leeds Institute for Data Analytics (LIDA) Data Scientist Development Programme, which employs early-career data scientists to deliver real-world data-driven impact in the interests of the public good.
References
- S. V P, M. Yusuf Hassan, and M. Singh, “LineEX: Data Extraction from Scientific Line Charts,” in 2023 IEEE/CVF Winter Conference on Applications of Computer Vision (WACV), 2023, pp. 6202–6210. doi: 10.1109/WACV56688.2023.00615.
- A. Rohatgi, “WebPlotDigitizer.” [Online]. Available: https://automeris.io
- E. H. Rutter and C. T. Glover, “The deformation of porous sandstones; are Byerlee friction and the critical state line equivalent?,” J Struct Geol, vol. 44, pp. 129–140, Nov. 2012, doi: 10.1016/J.JSG.2012.08.014.
- T. F. Wong and P. Baud, “The brittle-ductile transition in porous rock: A review,” J Struct Geol, vol. 44, pp. 25–53, Nov. 2012, doi: 10.1016/J.JSG.2012.07.010.
- J. Byerlee, “Friction of rocks,” Pure Appl Geophys, vol. 116, no. 4–5, pp. 615–626, Jul. 1978, doi: 10.1007/BF00876528.