
Carbon Footprint of Food at the University of Leeds
Olawale Ogundeji1, Francesca Pontin12, William James13, Claire Booth4
1Leeds Institute for Data Analytics, University of Leeds
2Consumer Data Research Centre, University of Leeds
3School of Geography, University of Leeds
4Sustainability Service, University of Leeds
___________________________________________________________________________
Introduction
This project is designed to develop a carbon calculator to estimate the carbon footprint of food prepared and sold at the University to communicate the environmental impacts of food as part of the University’s pathway and strategy to reduce the greenhouse gas emission to achieve net zero by 2030 and consequently create a fairer and sustainable environment.
Project overview
The climate crisis has recently been one of the world’s most significant challenges. To avert this crisis, control of carbon emissions and promoting low-carbon lifestyle choices have become increasingly prevalent among individuals, organisations, and governments. Food production accounts for a quarter of greenhouse gas emissions responsible for most of global warming and is accountable for up to 30 per cent of households’ carbon footprints. However, managing carbon emissions and creating sustainable environments through the food supply chain requires an excellent understanding of the food system and effective communication of its environmental impacts. This project is designed to develop a carbon calculator to estimate the environmental impacts of food prepared and sold at the University.
Research methodology
Data Collection: The data for this research was expected to be collected from some of the food products suppliers to the University through the University’s Purchasing Team and Catering Services. However, due to some challenges in getting data from suppliers, I worked with a small dataset from the menus for the Students’ Research Sustainability Conference, held on the 28th of March 2023, at the University of Leeds.
Methods
- Ingredients were extracted from the information provided, and their proportions were estimated based on the percentage composition in the individual recipes. The proportions of ingredients whose percentage compositions were not given were obtained using the relationship of the estimated composition of other ingredients or information from a similar product. For recipes with various ingredients in small units or quantities, the proportions were obtained by summing up their compositions with main ingredients.
- Linking the products’ ingredients to the environmental database that contain greenhouse gas emission indicator in kg C02 kg of ingredients derived from a meta-analysis of life cycle assessments of food products by considering all the inputs used during the food production. The ingredients in the food products’ dataset are matched to the corresponding ingredients in the environmental database with fuzzy matching algorithms, looping through the database to match all the ingredients with conditions when necessary. In addition, the ingredients are matched to close substitutes in the database in a few instances where the exact match is not achieved.
- Estimation of the environmental impacts of the food. The environmental impact scores of ingredients are obtained with the product of their weights and corresponding greenhouse gas emission indicators. The environmental impact scores of ingredients in each recipe are summed up to estimate the environmental impact (carbon footprint) of the food products. The greenhouse gas emission of that product measures the impact of that product on climate change.
- The carbon footprints of the analysed foods are compared to the greenhouse gas emissions of common or everyday actions as comparison metrics.
Key findings
| S/N | Menus | Category | Weight (g) | Carbon Footprint (gC02eg) |
| 1 | Vegan Salted Caramel Cheesecake | Cakes | 95 | 229 |
| 2 | Raspberry Brownie Cake | Cakes | 110 | 464 |
| 3 | Avocado Piri Piri Humous | Sandwiches | 200 | 315 |
| 4 | Cheesly Savoury | Sandwiches | 200 | 277 |
| 5 | Falafel Crumble, Salsa, and Coriander | Sandwiches | 200 | 384 |
| 6 | Classic Ham Salad | Salads | 100 | 360 |
| 7 | Dressed Leaf Salad | Salads | 28 | 18 |
| 8 | Roast Vegan and Grain Salad | Salads | 240 | 220 |
| 9 | Roasted Chickpea, Avocado and Cucumber Bites | Salads | 62 | 102 |
| 10 | Gluten-Free Tortilla | Wraps | 250 | 486 |
| 11 | Onion Bhaji | Wraps | 250 | 323 |
| 12 | Vegan Sausage Rolls | Sausages | 91 | 71 |
| 13 | Pork Sausage | Sausages | 110 | 369 |
| 14 | Fruit Platter | Fruits | 233 | 106 |
| 15 | Gyozas | Gyozas | 42 | 55 |
Table 1: Food products with corresponding Carbon Footprint in gC02eg
As shown in the Table and Figure 1 below:
- The Raspberry Brownie Cake and the Gluten-Free Tortilla Wraps have the highest carbon footprint per serving among all the menu items, at 464 gC02eg and 486 gC02eg respectively. These items may be less environmentally sustainable compared to the other items.
- The Dressed Leaf Salad has the lowest carbon footprint per serving among all the menu items, at 18 gC02 Therefore, this item may be the most environmentally sustainable.
- The Avocado Piri Piri Humous, Cheesly Savoury, and Falafel Crumble, Salsa, and Coriander sandwiches have similar weights of 200g. However, the carbon footprint per serving varies from 277 gC02eg to 384 gC02 This suggests that the choice of ingredients can significantly impact the carbon footprint of the food.
- The Pork Sausage and the Vegan Sausage Rolls have similar weights of 110g and 91g respectively. However, the carbon footprint per serving varies greatly from 71 gC02eg to 369 gC02 This indicates that pork in the pork sausage significantly impact its carbon footprint.
- The Gyozas have a relatively low weight of 42g. However, the carbon footprint per serving is 55 gC02eg, which is relatively low compared to most other items. This may imply that smaller portion sizes can contribute to reducing the carbon footprint of food.

Figure 1: Carbon Footprint of food items per servings in the menu by category
As shown in the Figure 2 below, pork, which comprises only 20% of all the ingredients in the Classic Ham Salad, is responsible for over two-thirds of the greenhouse gas emissions. Similarly, the avocado in Avocado Piri Piri, which constitutes just 17% of the ingredients, contributes to up to one-third of the food product's carbon footprint.
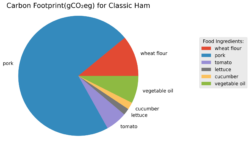
Figure 2: Carbon Footprint’s proportions of the ingredients in Classic Ham Salad
Comparison Metrics
| 1 | Boiling a litre (1000g) of water in an average electric kettle emits 15.6g of C02 equivalent, slightly lower than 18 gC02eg of 28g Dresses Leaf Salad. |
| 2 | Driving an average Dutch passenger car for 2.5 miles has CO2 emissions of 431.7, which is close to the carbon footprint of eating 110g of Raspberry Brownie Cake of 464 gC02eg. |
Value of the research
The project is aiming at creating a carbon calculator for the University’s Catering Services to estimate the carbon cost of the food prepared and sold at the University of Leeds and provide relevant information about the climate impact of these foods through front-of-pack ecolabels as a behavioural strategy driving diet changes and promoting low-carbon food choices to minimise the greenhouse gas emissions from food.
Our food choices are germane to the sustainability of the environment. Reducing the consumption of food items with high carbon costs can help combat climate change as food alone along its supply chain contributes more than 25% of total global greenhouse gas emissions. The University of Leeds’ Catering Services serves a population of 46,000 staff and students with 17 food outlets. Therefore, this project has enormous potential to contribute to the University’s Pathway to Net Zero by 2030 and drive its commitment efforts to create a fairer, more sustainable environment through research and collaborations.
Quote from project partner
“This is great as we can compare emissions from our food to driving an average Dutch passenger car for 2.5 miles or boiling a litre of water in an average electric kettle.” Joanne Jordan MCIPS; Senior Category Officer, Facilities Directorate, University of Leeds.
Insights
- The choice of ingredients can significantly impact the carbon footprint of the food.
- As revealed, animal products like pork have a higher carbon emission than plant-based products.
- As shown, grains contribute a higher greenhouse gas emission in recipes than other plant-based ingredients.
- Avocado, vegetable oil, and rapeseed oil also emit considerable greenhouse gases.
- The carbon footprint of food ingredients is a measure of greenhouse gas emission factors, not necessarily their weights.
- The portion size of ingredients can also influence the carbon footprint of food.
Research theme
- Environment
- Societies
Programme theme
- Data Science Infrastructures
- Statistical Data Science
- Mathematical and Computational Foundations
People
Claire Booth; Sustainability Programme Officer, Sustainability Service, University of Leeds
Dr Francesca Pontin; CDRC Research Data Scientist, Consumer Data Research Centre, University of Leeds
Dr William James; Research Fellow, School of Geography, University of Leeds
Julie Tong; Head of Retail Catering, Facilities Directorate, Catering Services, University of Leeds
Joanne Jordan MCIPS; Senior Category Officer, Facilities Directorate, Purchasing Team, University of Leeds
Olawale Ogundeji; Data Scientist, Leeds Institute for Data Analytics, University of Leeds
Partners
Consumer Data Research Centre, University of Leeds, Sustainability Service, University of Leeds, Catering Services, University of Leeds and Purchasing Team, University of Leeds
Funders
The project is funded by Consumer Data Research Centre, University of Leeds.