Finding Healthy Online: What the Eyes Reveal
Gauri Venkatachalapathi, Dr. Sally Moore, Dr. Yael Benn, Dr. Victoria Jenneson, Dr. Peter Ho
University of Leeds, Manchester Metropolitan University and Ocado Retail
Despite the shift to online food purchases, fundamental questions about how our food choices impact our health and the planet remain. Tracking eye movement on the screen can reveal where shoppers focus when making these decisions. This project asks: How do shoppers use supermarket websites (like viewing, page types, etc.) during real-life shopping, and how might this influence their purchases?
Project overview
In the UK and worldwide, diets often fall short of best practice recommendations, for example, low fruit and vegetable consumption and excessive sugar and salt (Briazu et al., 2024), creating public health and sustainability challenges. The COVID-19 pandemic accelerated online grocery shopping and brought new and diverse users to digital food platforms, including those with no previous online shopping experience. Supermarket website design and product placement can influence purchasing behaviour. New legislation in England (Department of Health and Social Care, 2022) now restricts the placement of foods high in fat, sugar, or salt (HFSS) in physical and online supermarkets. Understanding how consumers interact with digital food environments during real-life shopping and how these environments can support healthier and more sustainable diets is essential for informing policy and retailer practices.
This project, Finding Healthy Online (FHO): What the Eyes Reveal, is among the first pivot studies to objectively evaluate real-world consumer behaviour in online supermarket settings beyond sales data, using novel approaches like eye-tracking (Faculty of Environment, 2024; Benn et al., 2015). Analysing detailed eye-tracking data from ten real-life shoppers using the Ocado Retail website alongside their survey responses and purchase receipts, we investigate their website navigation, webpages used, attention patterns, and their relation to actual purchases. The project integrates psychology, nutrition, and data science in an academic-industry collaboration between the University of Leeds, Manchester Metropolitan University, and Ocado Retail. This interdisciplinary approach generates preliminary insights in the form of a dashboard, which can potentially inform future decisions with scientific and real-world impact, supporting online supermarket designs that nudge customers towards healthier and more sustainable food choices.
Data and methods
Data Sources
This project uses three main FHO data sources: page-level eye-tracking data, participants’ purchase receipts, and participants’ survey responses, offering a multi-layered picture of how consumers navigate online supermarkets and make food choices. Ten participants shopped and paid for groceries on Ocado.com at Manchester Metropolitan University’s eye-tracking lab, where their eye movements were recorded using a Tobii Pro Spectrum 1200. Participants were not given a spending budget but had to spend more than £40 for delivery, and each received a £40 voucher as a participation reward. Combining gaze-data, purchases, and survey information reveals the link between participants’ personal circumstances, purchases and their website interactions.
1. Eye-tracking Data
This data, captured by Tobii Pro Spectrum 1200, provides millisecond-level granular insights into participants’ gaze behaviour on the Ocado Retail website. Each shopping journey (7 to 61 minutes, 23.11 average, 16.22 STD) generated thousands of events, classified into fixations (when gaze lingers) and saccades (eye movements between fixations, see Fig.1). The research team coded Areas of Interest (AOIs), including whole webpages or elements like product images, prices, or banners. These raw gaze logs were processed using Tobii Pro Lab, exported into individual Excel files, cleaned, and consolidated into a single dataset. Figure 1 illustrates the eye-tracking capture process. Our dashboard outcome measures include fixation, and saccade counts (number per AOI) and durations (total time spent on fixations/saccades per AOI). Only page-level AOIs are used in this current iteration of the dashboard, with future potential to expand insights to include feature-level AOIs.
![]()
2. Participant Receipt Data
Purchase receipts, collected for each participant showed what the participants are buying and why. The data includes product name, quantity, price, product category, sub-category (allocated by Ocado Retail), and purchase type (participant self-reported). Purchase types indicated whether the purchase was usual, replacement, new, reminder impulse, or spontaneous. Figure 2 shows a receipt data snapshot and corresponding purchase types.

Figure 2: A snapshot of the receipt data
3. Participant Survey Data
All participants completed a pre-shop survey, answering questions on demography (e.g., age, gender, household size), dietary preferences/restrictions, shopping frequency, shopping styles, and preferences. The survey also asked about planned purchases, use of shopping lists, shopping budgets, and prior Ocado experience. Figure 3 illustrates some of these questions. The information contextualised the gaze and purchasing behaviour.

Figure 3: Sample questions from the pre-shop participant survey.
Data Integration and Processing
The three datasets - eye-tracking, receipts, and survey responses — were extracted, merged using Excel, and transformed and loaded using R. Figure 4 illustrates the overall workflow.
- Eye-tracking processing: Each participant's data was checked for blank participant IDs and combined into a single 10-participant dataset. The processing included standardising event labels, harmonising and mapping AOIs to product categories (e.g., Fresh) and sub-categories (e.g., Vegetables), extracting arrival source (e.g., Search Webpage), and adding shopping durations. This dataset enabled examining relationships between attention and shopping behaviour.
- Receipt data processing: Individual receipt data were combined into one dataset for all participants, cleaned and standardised with purchase-type columns converted from “x” entries into “Yes/No” fields (“x” = Yes; blank = No). By merging these records with eye-tracking data, the project answered questions like: ‘Do shoppers buy from categories they view most?’, ‘Does longer fixation duration mean higher spending?’
- Survey data processing: The raw survey data contained survey questions as column names, which were renamed using a mapping vector into clean, descriptive labels. Ambiguous dietary and medical responses were standardised, and binary flags created for adult/children counts. This dataset was crucial in identifying differences across participant groups, e.g., between families with children versus single-person households, or list-makers versus spontaneous participants.
- Integration: Datasets were joined using participant numbers when producing the dashboard visuals, ensuring reproducibility and transparency.

Figure 4: Data Processing Workflow
Dashboard Development
The three-section Quarto dashboard provided a logical journey—from overall attention patterns to shopper characteristics to individual shopping stories—useful for researchers and the general audience. Built in R, it consolidates datasets, enabling exploration of fixation patterns, purchases, and survey responses through interactive Plotly visuals (Sievert, 2020). Shared via GitHub, there is a demo video with the first section as a public link, and the others available on request. Clear visuals and filters enable interactivity and intuitiveness.
Section 1: Shopping Overview
Figure 5 summarises overall gaze patterns and shopping duration across participants. Visuals include fixation vs saccade durations, fixation distribution across webpages, quick info cards, top AOIs by category, and alignment between attention and purchases. This section highlights aggregate trends, e.g., how purchases by categories relate to the category viewing time.

Figure 5: What the Eyes Reveal - Shopping Overview
Section 2: Participant Overview
Enables cross-participant comparisons, with dynamic filters (age, gender, shopping style, dietary restrictions). Key visuals include a butterfly chart comparing fixation time vs money spent, scatter plots of fixation duration vs purchases, and tables of webpage use (Fig.6). This section demonstrates how participants’ behaviour varies by demographic or shopping preference.

Figure 6: What the Eyes Reveal - Participant Overview
Section 3: Individual Participant Views
Provides detailed information about each of the ten participants. Cards summarise demographic and shopping attributes (e.g., age, household, dietary requirements, spend, etc.). Visuals show basket composition, their variations by quantity/value, supermarket preferences, alignment with group behaviours, and fixation distributions (Fig.7), illustrating heterogeneity of individual’s shopping behaviours.

Figure 7: What the Eyes Reveal - Individual Participant View - Participant 1 View
Some Key findings
What did shoppers look at?
The Search webpage received the overall highest fixation duration share (43.3%), meaning participants often searched their products directly. However, the main arrival source for the younger participants (ages 26-35, n=4) was Browse webpage (32.7%), suggesting younger shoppers preferred exploring categories than searching for items. Page counts mirrored this trend for both the groups (Table 1).
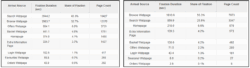
Table 1: What is the most viewed arrival source? Left: All Ages, Right: Ages 26-35 yrs
Attention to products also clustered around everyday essentials. Fresh foods and Food cupboard staples drew the highest fixation counts across participants, while categories such as Non-Food and Bakery received comparatively little attention (Fig.8).

Figure 8: How are top 10 AOI fixations distributed across product categories?
These findings illustrate how the available website navigation options are utilised during online supermarket shopping (search and browse) and that attention is concentrated around staple food categories (webpage types). Promotional offers and seasonal products, while present, played a relatively minor role in attracting participants’ gaze.
How does looking relate to buying?
Comparing fixation duration with spending at the participant level (Fig.9) shows that attention did not always mean higher expenditure, e.g., several participants devoted long viewing times to Fresh products without proportionate spending, suggesting that attention may reflect browsing rather than purchase intent. Exploring the qualitative interviews with participants can provide insights into these trends.

Figure 9: How does looking relate to buying?
At the product-category level, scatter plots (Fig.10) highlight weak but visible links between attention and purchase. While some Fresh and Food Cupboard items showed association between fixation time and both spending and product count, many other fixations did not result in purchases.

Figure 10: Is there any association between fixation duration and spend?
These findings suggest that while attention is an important predictor, it is not sufficient—other factors may also shape purchase behaviour.
What are the data challenges + what’s needed going forward?
The dataset is small, with only ten participants. This is due to the large amount of eye-tracking data, which has millisecond-level granularity. The fine AOI structure had overlapping or inconsistently tagged elements that needed manual cleaning, thus highlighting the importance of careful data management and transparent processing pipelines. Different shopping journeys meant not all datasets were directly comparable, reflecting individual shopping habit differences.
Future work could expand the sample size, refine AOI mapping, and build on the reproducible codebase developed here to support further analysis. For larger sample sizes (for example, n>25), it would be ideal to use database systems for faster data loading. These steps are documented to ensure that the dataset and dashboard can be readily handed over for revision, extension, and application in larger-scale studies.
Value of the research
This project has informed Ocado Retail’s 2024–25 public-facing Sustainability and Health Strategy, demonstrating early policy impact and supporting future public health improvements through optimised website design encouraging healthier, more sustainable food choices. Recognised as a model academic–industry partnership, this collaboration strengthens Ocado’s strategic direction and lays the groundwork for further research, public health engagement, and larger-scale data-driven interventions within digital food environments.
Quote from project partner
“The ORIC funded pilot study used eye tracking and qualitative insights from participants shopping on ocado.com to reveal what traditional consumer research cannot. Our findings indicated that this innovative research method can inform future design to support ease of use and healthier food choices for our customers. Due to the pilot’s success, we secured further funding to collect more data.”
Featured on Ocado’s Sustainability and Health Strategy page here.
Insights
- Eye-tracking can successfully capture real-life online shopping behaviour, despite requiring complex manual processing and detailed AOI mapping.
- Future studies should aim to tag product-level image views and link them to purchases, enriched with qualitative quotes.
- The dashboard highlights clear variation in shopping styles, including time spent, product counts, and navigation patterns, which warrant further exploration in larger studies.
- Search and browse pages appear to be dominant routes; optimising these could support healthier online food choices.
- Scaling up with a larger sample and finer AOI precision is essential for broader insights.
Research theme
- Health
- Societies
- Environment
- Food
Programme theme
- The Science of Data Science
- Visualisation/ Extended Reality
Team
Gauri Venkatachalapathi - Data Scientist, Leeds Institute for Data Analytics, University of Leeds.
Dr. Sally Moore - Lecturer Nutrition Science, Registered Dietitian, Programme Leader BSc and MSc Nutrition, School of Food Science and Nutrition, University of Leeds.
Dr. Yael Benn - Senior Lecturer, School of Psychology, Manchester Metropolitan University.
Dr. Peter Ho - Lecturer in Food Processing, School of Food Science and Nutrition, University of Leeds.
Dr. Victora Jenneson - Research Fellow Nutrition Data Analytics, School of Food Science and Nutrition, University of Leeds.
Partners
Ocado Retail Ltd.
Manchester Metropolitan University
Funder
ESRC IAA LSSI (Impact Acceleration Account Leeds Social Science Institute) exclusively for promoting women in data science.
This work has been facilitated by the Leeds Institute for Data Analytics (LIDA) Data Scientist Development Programme, which employs early-career data scientists to deliver real-world data-driven impact in the interests of the public good.
References
- Benn, Y., Webb, T.L., Chang, B.P.I. and Reidy, J. (2015). What information do consumers consider, and how do they look for it, when shopping for groceries online? Appetite, 89, pp.265–273. doi:https://doi.org/10.1016/j.appet.2015.01.025.
- Briazu, R.A., Masood, F., Hunt, L., Pettinger, C., Wagstaff, C. and McCloy, R. (2024). Barriers and facilitators to healthy eating in disadvantaged adults living in the UK: a scoping review. BMC public health, 24(1). doi:https://doi.org/10.1186/s12889-024-19259-2.
- Department of Health and Social Care (2022). DHSC annual report and accounts: 2022 to 2023. GOV.UK. Available at: https://www.gov.uk/government/publications/dhsc-annual-report-and-accounts-2022-to-2023.
- Faculty of Environment (2024). Finding Healthy Online. Leeds.ac.uk. Available at:https://environment.leeds.ac.uk/food-nutrition-research-innovation/dir-record/research-projects/1893/finding-healthy-online.
- Sievert, C. (2020). Interactive Web-Based Data Visualization with R, plotly, and shiny. Chapman and Hall/CRC. ISBN 9781138331457. Available at:https://plotly-r.com.