
Longitudinal Biomarker Trends in Multiple Myeloma Patients During Treatment and Impact on Outcomes
In partnership with with UK Myeloma Research Alliance and Haematological Malignancy Research Network.
Multiple myeloma is a blood cancer that develops when abnormal plasma cells accumulate in the bone marrow. Plasma cells normally produce antibodies that help the body fight infection. In myeloma, these abnormal cells can produce large amounts of a single monoclonal antibody or antibody fragment, which may be detected in the blood as paraprotein. The disease can affect the bones, blood production, immune system and kidneys, and patients can respond to treatment in very different ways (Myeloma UK, 2020).
Clinical assessment at diagnosis is important for establishing disease severity and guiding treatment. However, measurements taken at diagnosis provide only a snapshot of the disease. Once treatment begins, biomarkers can change in different ways: some patients may show a rapid decline, others a slower response, while levels may remain persistently elevated in others. Examining these changes over time may therefore provide information about treatment response and subsequent outcomes that may not be captured by baseline measurements alone (Hussain et al., 2024).
This project used data from the Myeloma XI clinical trial to examine how two routinely measured biomarkers changed during the first three months of treatment. Paraprotein is produced by myeloma plasma cells and is commonly used to monitor disease activity and response to treatment (Myeloma UK, 2020). Beta-2 microglobulin (B2M) is an established prognostic marker in multiple myeloma, although its concentration is also influenced by kidney function because it is cleared from the blood by the kidneys (Hasan et al., 2026).
The study addressed three connected questions:
- Could repeated measurements identify groups of patients following distinct biomarker trajectories?
- Did the clinical characteristics of patients differ between these trajectory groups?
- Were the patterns observed during the first three months of treatment associated with subsequent progression-free or overall survival?
The overall aim was to investigate what longitudinal laboratory data could add to the understanding of treatment response and later patient outcomes.
Data and Cohort Development
Myeloma XI was a large Phase III randomised clinical trial conducted across 110 hospitals in the United Kingdom between 2010 and 2016. It evaluated treatment strategies for people with newly diagnosed multiple myeloma across transplant-eligible and transplant-ineligible pathways (Jackson et al., 2019). This project used the trial data for a secondary analysis, exploring whether routinely collected longitudinal laboratory measurements could provide additional insight into treatment response and later outcomes.
The analysis drew on three linked data sources. The first contained baseline characteristics and clinical outcomes for more than 4,000 participants, including demographic information, disease stage, treatment pathway, progression-free survival and overall survival. A longitudinal local laboratory dataset contained more than 80,000 records and provided repeated paraprotein measurements for almost the full trial cohort. A separate central laboratory dataset contained over 30,000 records for approximately 2,500 participants and included B2M alongside other laboratory markers. The smaller B2M cohort reflected the more limited availability of central laboratory measurements across the trial.
The datasets were linked using the trial patient identifier, after which separate analytical cohorts were developed for paraprotein and B2M. Patients required sufficient biomarker measurements during the first three months of treatment to allow their longitudinal pattern to be characterised. Survival analyses were then restricted to patients who remained under observation beyond this three-month period and had the relevant outcome information available. Consequently, the number of patients contributing to the trajectory, progression-free survival and overall survival analyses varied slightly.
All analyses were conducted within the approved LICTR data environment. The public-facing dashboard contains only aggregated results, model estimates and non-identifiable fig
[Figure 1: Study design and analytical workflow]

Preparing Longitudinal Laboratory Data
Substantial preparation was required before modelling. Trial-coded clinical and laboratory variables were first translated into interpretable categories, including sex and treatment pathway, and R2-ISS stage was derived from the available staging, cytogenetic and laboratory information using the published scoring system, allowing classification of more than 90% of participants. The data were then checked for duplicate records, implausible values, missing information and inconsistent variable formats. To define a consistent pre-treatment starting point, baseline measurements were restricted to those collected within the 30 days before treatment initiation. Paraprotein required additional processing because laboratories did not always report an exact numerical concentration. Some results were recorded as not detectable, too low to quantify or below the assay’s detection limit. Treating these observations as missing would discard evidence of a low paraprotein concentration and could disproportionately exclude measurements from patients responding to treatment. Assigning a value of zero would incorrectly suggest that paraprotein was completely absent and measured with certainty. Results explicitly reported below the 1.0 g/L detection limit were therefore assigned 1/√2 g/L (approximately 0.71 g/L), a conventional substitution that retained these observations without claiming greater precision than the laboratory result supported.
Once the data had been prepared, the overall cohort was characterised using descriptive statistics, Kaplan–Meier curves and Cox regression to describe the study population and examine how established clinical characteristics related to progression-free and overall survival. The longitudinal analysis then used repeated paraprotein and B2M measurements from baseline through the first three months of treatment to characterise biomarker trajectories. This period allowed initial patterns of biomarker response to emerge while establishing a clear three-month landmark from which subsequent progression and survival could be examined. Paraprotein and B2M were analysed separately because they reflect different biological processes, were available for different patient groups and require different clinical interpretation.
Identifying Biomarker Trajectories
Latent class growth analysis (LCGA) was used to identify groups of patients whose biomarker measurements followed similar patterns over time. LCGA assumes that a population may contain several unobserved, or latent, groups with distinct average trajectories, with patients within each group sharing a similar underlying pattern of change despite variation in their individual measurements (Jung and Wickrama, 2008; Andruff et al., 2009). Separate models were fitted to repeated paraprotein and beta-2 microglobulin (B2M) measurements within the defined three-month trajectory window. The groups were not defined in advance using clinical thresholds; instead, the models used the timing and values of each patient’s repeated measurements to estimate the underlying trajectories. Each patient received a probability of belonging to each class and was assigned to the class with the highest probability. Models containing between two and six classes were compared using Bayesian Information Criterion (BIC), entropy, posterior class-membership probabilities, class size, model convergence and the clinical plausibility of the estimated trajectories. The final models were selected by considering these measures together rather than relying on any single statistic.
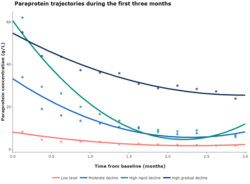
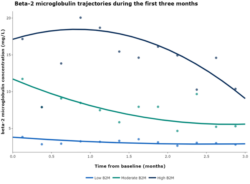
The final paraprotein model identified four trajectory patterns: Low-level, Moderate decline, High rapid decline and High gradual decline, containing 1,387, 1,988, 490 and 263 patients, respectively. The B2M model identified three patterns: Low B2M, Moderate B2M and High B2M, containing 1,340, 155 and 37 patients, respectively. These labels describe the estimated biomarker level and pattern of change observed in the data. The small “High B2M” (N=37) class was retained because it represented a distinct trajectory, but its size should be considered when interpreting subsequent results.
[Figure 2: Paraprotein trajectories during the first three months of treatment]
[Figure 3: B2M trajectories during the first three months of treatment]
Examining Outcomes After the Trajectory Window
A three-month landmark design separated the period used to identify biomarker trajectories from the subsequent outcome period. Overall survival (OS) analyses included patients who were alive at three months, while progression-free survival (PFS) analyses included those who were alive and had not experienced disease progression. This prevented biomarker information collected during the trajectory window from being related to outcomes that had already occurred.
Kaplan–Meier curves were used to compare PFS and OS between the trajectory classes. Cox proportional hazards models estimated these associations before and after adjustment for age, sex, R2-ISS stage and treatment pathway. The results describe group-level associations and do not establish that trajectory membership caused an outcome or predict what will happen to an individual patient.
Key Findings
The paraprotein analysis showed why both biomarker context and the pattern of change matter. More than one quarter of the Low-level group had light-chain-only disease, in which malignant plasma cells mainly produce free light chains rather than an intact immunoglobulin detectable as serum paraprotein. A low paraprotein trajectory therefore did not necessarily indicate a low disease burden.
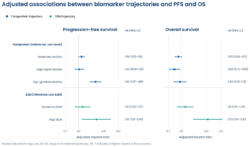
The two groups that began with high paraprotein concentrations showed different associations with subsequent outcomes. Patients in the High rapid decline group were younger, with a median age of 64 years, and 68.6% were in the transplant-eligible pathway. This group had no evidence of poorer progression-free survival than the Low-level group and had a lower adjusted hazard of death in the overall survival analysis (HR 0.83, 95% CI 0.72–0.96). By contrast, the High gradual decline group experienced the poorest progression-free survival, with a higher adjusted hazard of progression or death (HR 1.60, 95% CI 1.37–1.86). These findings suggest that the rate of paraprotein decline provided information beyond the starting concentration alone.
[Figure 4: Myeloma secretory type across the paraprotein trajectory classes]

[Figure 5: PFS for PP]
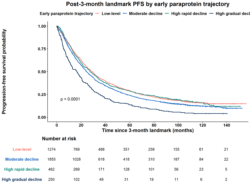
[Figure 6: OS for PP]

The B2M analysis revealed a different clinical story. Most patients followed the Low B2M trajectory, while a small group remained elevated. Patients in the High B2M group were older, with a median age of 72 years compared with 66 years in the Low B2M group, and were less commonly in the transplant-eligible pathway. Further investigation showed a strong kidney-function gradient across the three groups. Median serum creatinine increased from 85 micromoles per litre in the Low B2M group to 153 in the Moderate B2M group and 224 in the High B2M group. Median estimated glomerular filtration rate, calculated using the 2021 creatinine-based CKD-EPI equation (Inker et al., 2021), fell from 78.5 to 38.7 and 23.7 millilitres per minute per 1.73 square metres respectively.
These differences in kidney function were clinically substantial. B2M rises with increased cellular turnover and disease activity, but reduced kidney clearance can also raise its concentration. Persistently high B2M was therefore reflected more than myeloma-related disease burden; it also carried a pronounced renal-function signal. This distinction matters because kidney impairment is itself a serious complication of myeloma and may affect treatment options, treatment tolerance and prognosis.
Higher B2M trajectories were associated with poorer progression-free and overall survival. The unadjusted models described the overall differences between the groups, while the adjusted models assessed whether these differences remained after accounting for age, sex, R2-ISS stage and treatment pathway. The High B2M group continued to have a higher hazard of progression or death after adjustment (adjusted HR 1.63, 95% CI 1.10–2.42), showing that the trajectory remained associated with progression-free survival after accounting for these clinical characteristics. As baseline B2M contributes to the ISS component of R2-ISS, adjustment for R2-ISS also accounts for part of the biomarker information captured by the trajectory. Taken together with the marked renal impairment observed in this group, persistently high B2M identified a particularly vulnerable group of patients with overlapping disease-related, renal and prognostic risks.
[Figure 7: PFS for PP]

[Figure 8: OS for PP]

[Figure 9: Adjusted associations between biomarker trajectories and PFS and OS]
Value of the Research & Next Steps
This project demonstrates the value of analysing repeated laboratory measurements as patterns of change rather than relying on a single baseline result or an overall cohort average. The analysis identified clinically meaningful variation in biomarker levels and treatment response that would otherwise have been obscured. It also showed that trajectories must be interpreted in the biological context of each biomarker, particularly myeloma secretory type for paraprotein and kidney function for B2M. The project further demonstrates how LCGA can be applied to routinely collected longitudinal laboratory data to identify data-driven patterns that may be hidden. This approach could be explored for other repeatedly measured biomarkers where patients may follow different patterns over time.
The trajectory groups should next be validated in an independent myeloma population, with attention to the High B2M group. Further research should also establish whether adding trajectory information improves prognostic assessment beyond R2-ISS stage and conventional treatment-response measures.
The project also produced an interactive dashboard presenting the trajectory patterns, aggregated patient characteristics, landmark survival curves and Cox regression results. By bringing together the statistical findings and their biological and clinical interpretations, the dashboard supports further exploration of the results while protecting patient confidentiality.
Following a review of the dashboard, Martin Kaiser, at Institute of Cancer Research, commented: “The dashboard presents complex analyses in a clear, logical and transparent format, making the findings accessible and useful to clinicians.”
The dashboard can be accessed here: Myeloma XI Biomarker Trajectories
Team
- Damilola Ogungbemi - Data Scientist, Leeds Institute for Data Analytics
- Dr Lesley Smith - Leeds Institute of Clinical Trials Research
- Professor David Cairns - Leeds Institute of Clinical Trials Research
- Dr Chris Parish - Leeds Teaching Hospitals NHS Trust