
Machine Learning Methods for Rapid Cyber Incident Response
In April 2024 the names, dates of birth, phone numbers, and addresses of 2.9 billion people were exposed and sold online by a cyber attacker[1]. Just two months later another attack left one person dead[2].
Over the last five years the number and severity of cyber attacks has grown significantly. The latest data gathered by the UK government cyber security survey showed 1 in 3 British charities reported being the victims of attacks that year[3].

Figure 1: Stacked area plot of the number of reported cyber attacks per year by sector. Based on data from the UK Government Cyber Security Breaches Survey data accessed via the UK Data Service.
The data also showed ransomware attacks are on a particularly steep rise, having doubled in number compared to the previous year[3], with the NCSC 2025 annual review noting “Ransomware conducted by financially motivated criminals continues to be the most immediate, disruptive threat to critical national infrastructure[6]
Ransomware attacks involve an attacker gaining unauthorised access to a secure system and encrypting the organisation's files, rendering them entirely unreadable until a specific key is provided. The attacker then offers to provide that key for a price.
Despite the growing threat, the impacts of cyber crime can often be hard to conceptualise, with consequences felt far downstream of the initial incident; how exactly did such a ransomware attack lead to a death?
This particular case involved an NHS partner organisation Synnovis, which performs pathology services such as blood and urine tests for NHS patients[5]. Synnovis was the victim of a ransomware attack, compromising patient and clinician confidential data, causing disruption and delays to over 10,000 patients, and resulting in more than 1,000 planned operations being postponed. It was these delays that prevented an anonymous South London patient from getting the timely blood results which may have prevented their death.
The massive expenditure of time, money and labour required in responding to and recovering from this incident caused massive disruption to Synnovis’ vital operations. This underscores the importance of rapid and effective response to mitigate impact, address vulnerabilities and ensure that critical services are brought back online as quickly as possible.
To that end, this project conducts a thorough review of the applicability and efficacy of data science and automation for improving response to cyber incidents.
The Project
Investigating the causes of an attack and tracing the actions of the attacker is the critical first step in responding to an incident. This investigation work is highly technical and complex, requiring expert, highly-trained staff whose skills are in exceptionally high demand. These staff pore over huge pools of unstructured data searching for the needle in the haystack which indicates what an attacker has done and how they have done it. Understanding how an attacker has entered a system is key to pluggingthis gap and ensuring that the attacker is fully eradicated from the environment and cannot regain access. These clues are mixed in amongst a sea of normal, safe data, produced in the regular operation of the company; made even more elusive by the adversarial relationship with attackers actively trying to obscure the evidence of their crimes or regain access to the victim’s systems.
However, what if historic data could be used to extract patterns and build a model to automatically classify which artifacts were the result of threat actor activities? This would allow for incidents to be triaged quickly by guiding analysts directly to critical clues. While the appeal of such a model is clear, there are several challenges to realising the goal.
Firstly, it is exceedingly rare for any organisations to make data from their systems publicly available following a cyber attack, as the data is usually highly sensitive as well as potentially embarrassing for the affected company. Given the litigious nature of cyber incidents, with class action lawsuits relating to harm caused through the exposure of sensitive data, or between companies as a result of business disruption, the forensic data could be used to highlight vulnerabilities or weaknesses in the technical measures used by the victim. Furthermore, it is often in an organisation's financial interest to limit publicity about an incident to minimise reputational damage as much as possible. For these, among other reasons, almost all academic work applying data science techniques in this field is forced to rely solely on simulated, synthetic data, limiting the real-world utility of the results.
This project addresses this limitation through a unique partnership with a major global cyber incident response services organisation which responds to over 200 incidents per year; ranging from small business up to nation state activities. This partner consults with victim companies to provide services such as incident investigation, mitigation and recommendation and in the process has accumulated a vast, unprecedented set of up-to-date, real-world cyber incident data ideal for this use case. The partner organisation deals with hundreds of attacks of many types and the plot in Figure 2 shows the proportion of each type.
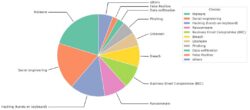
Figure 2: Pie chart showing the mix of incident types responded to by the partner organisation. An additional challenge when working with data in this domain is the diversity and variability of incidents. To address some of the variability, the project focused on ransomware attacks due to their growing prevalence and severity of impact. Despite this focus, individual ransomware incidents vary wildly in terms of the artifacts collected during the investigation. While all ransomware incidents involve an actor encrypting important data, each attack may use entirely different tactics to gain access, to perform the attack and to mask their tracks, as well as potentially targeting a variety of operating systems.
To understand how to best address these complexities it was necessary to conduct a full review of the available data. This process identified that the majority of data sources appeared in only a handful of incidents. These data were neglected in favour of larger sources which were better represented across cases. This survey identified the following consistent data sources:

The most extensive source with the most potential utility was identified as Windows Event Logs (WELs). These logs are automatically generated by Windows in the course of using the operating system. They document the exact times at which key system events occur. Events such as: a user logging on, a user permission being changed, an application being initialised, firewall activity, etc. These logs have particular utility in tracking the progress of ransomware attacks and for this reason, it was chosen to focus primarily on this data source.
Currently existing tools were used to parse these logs into comma-separated tables, ideal for manipulation in Python.
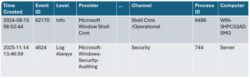
These logs exist for each machine involved in each incident and as such, a consolidation step was necessary to bring the data together before modelling.
Additionally, the raw data does not contain any labels to identify which logs are harmful and which are safe. To address this, it was essential to write tools to extract this information from internal working documents and match those insights with the raw logs.
Tooling
Many tools already exist which play major roles in the process of incident response. Some of these, such as KAPE, are used in this project to parse specific file formats. However, to leverage the powerful machine learning packages available in Python it is necessary to build bespoke tools for interfacing data between standard cyber security formats and Python’s ML libraries. Investing the time to build robust tools to facilitate locating and processing data proved invaluable for this work.
The first tool for this purpose was a Python module for displaying sophisticated warnings. Operations performed on such a large quantity inevitably take a significant period of time and frequently encounter unforeseen hurdles where data differs from expectations. Because of this, it is vital that these issues are handled elegantly, alerting the issue clearly with sufficient information for debugging, without halting the execution of the script. This custom warnings module (pretty-warnings) fulfils that requirement by displaying a traceback with both the line where the issue arose and the surrounding code context. It also makes use of ANSI escape codes to format the warning message appropriately, facilitated by another custom tool: fANSI-text.

Figure 3: Example code snippet displaying one use case for the custom warnings module.
Several other useful scripts were used to crawl various drives to locate and classify internal forensic data sources, with further tooling used to extract the details of which specific event logs were flagged as attacker actions. Once extracted, these were then matched with the consolidated log data to form the final dataset. However, due to the confidential nature of the partnership these tools are not available publicly.
One aspect of the extraction process which did produce a publicly available tool was a tool I named date-fuzz. Much of the useful information about each incident was contained in its written report which outlined the chronological progress of the attack. The process of extracting this data benefitted from the date-fuzz tool which was created to extract date and time information from text. While many Python packages already exist for extracting dates and times from a corpus of text, none were quite fit for this purpose. The date-fuzz tool is able make these detections in a way which is robust to the complex subtleties of human language and makes use of surrounding context clues to narrow down dates indicated by phrases such as “later the following day”.

Figure 4: Example code snippet showing the use of the date-fuzz module.
Once the foundational tools were created and the tools for locating, consolidating and labelling data were in place, a dataset was constructed ready to begin modelling. To facilitate rapid iteration, testing was carried out on a subset of data comprising four separate ransomware incidents. This testing dataset contained 9,460,812 records with 27 columns. Of the 9,460,812 records, only 73 were flagged as indicating threat actor activity meaning only 0.00077% of logs were dangerous.
Data Preparation
Feature Engineering
Preprocessing was applied to the dataset to extract insights into a form better suited for input into a machine learning model. The first phase of this process was to extract the “payload” data contained within the Windows Event Logs (WELs). This is a string based feature formatted similarly to a Python dictionary. Regular expressions were used to extract the following data: IP Address, User Name, Task Name, Target User Name, Logon Type, Application, Process ID, Interface Index, Source Address, Source Port, Dest Address, Dest Port, Parent Process Name and New Process Name. Next, several internal rules used by the program Chainsaw were reimplemented in Python to classify logs into broad categories such as “lateral movement”, assigning a binary classification to each entry using each of these rules. After this engineering, the final data contained 55 columns. Such high dimensionality data is hard to visualise clearly. Several t-SNE projections were created to attempt to provide a better intuition for the patterns in the data although to mixed results.

Figure 5: A two-dimensional t-SNE plot of a sample of 2000 points from the dataset.
Feature Selection
An XGBoost model was fit on the full selection to produce the following ranking of feature importance:

Based on this ranking the lowest importance features were ignored, and the remaining features were separated into numeric and categorical to apply the preprocessing pipeline.
Imputation and Encoding
The preprocessing pipeline both imputes missing values and encodes categorical values. One-hot encoding and ordinal encoding were tested but found to produce lower scores than target encoding.

Figure 6: Boxplot comparing the distribution of F1 scores for 3 encoding methods showing target encoding produces the best results.
The final pipeline is shown in Figure 6.
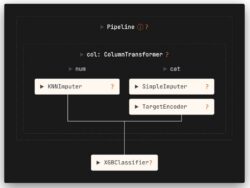
Figure 6: Diagram showing the pipeline used to preprocess and fit the XGBoost classifier model.
Handling Imbalance
As noted, the vast majority (99.99923%) of the records pertain to normal safe operation. This imbalance was handled in two key ways. Firstly, F1 scoring was employed to better weight the impact of the minority class. F1 score is equivalent to the harmonic mean of a model’s precision and recall. This ensures that “lazy” strategies such as simply predicting the modal value for all points gives a score of 0 instead of an accuracy of ~0.99999. Secondly, the synthetic oversampling technique SMOTE was also applied to the training data before model fitting. However, while this technique demonstrated strong training scores, it resulted in a much greater number of false positives and thus a major regression in F1 score.
Modelling
Two distinct types of modelling were applied to the dataset: supervised and unsupervised. Unsupervised modelling attempts to use statistical methods to identify patterns in the dataset which are used to locate outliers. These outlier entries are useful points for analysts to begin an investigation, providing some initial filtering to speed up the first stages of a response. The other techniques are supervised modelling;these instead fit classification rules based on the labels matched from the internal analyst documents.
Scoring & Evaluation
Each model was evaluated by taking a sample of 2,000,000 records from the data, splitting that sample into 5 segments, fitting on 70% of each segment and reserving the remaining 30% for testing and scoring. These 5 scores then provide a distribution for each modelling method. The table in Figure 7 shows box plots of the score distributions for four of these models.

Figure 7: Box plot showing five-fold cross validation scores evaluated on a sample of 2,000,000 records.
A further evaluation was conducted using the unsupervised methods producing the comparison shown below in Figure 8.
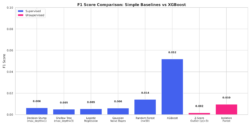
Figure 8: A comparative scoring between both supervised and unsupervised modelling techniques.
This evaluation identified extreme gradient boosted trees (XGBoost) as the clear victor in terms of performance. Running the model on the full sample of 2,000,000 and reserving 30% of points for testing, gives the results shown in the confusion matrix in Figure 9.

Figure 9: Confusion matrix showing the logs based on their true values and the model’s predicted values where 1 represents a log flagged as attacker activity and 0 represents safe logs.
The model displays an excellent 100% precision although suffers from a lower recall of 38.4%.
Conclusion
While this work is primarily exploratory in nature, the robust proof-of-concept data gathering, processing and modelling pipeline demonstrates promise for the applicability of machine learning for rapid cyber security classification on real world data. While the low recall precludes this POC from being a sufficient tool alone, the high precision suggests utility as an additional first-pass tool for flagging areas to begin an investigation. Further work is necessary to expand the training data beyond the four incidents sampled here and to provide more rigorous testing on the wide range of attack methodologies. Although the established pipeline is built to scale simply and effectively. Additional investigation into the nature of the records which are flagged correctly vs those that are missed by an incident response specialist would also shed some much-needed light on how the model fails and where it can be improved. I speculate that the model is missing important context clues which a human analyst would use to categorise accurately. For this reason, a key next step would likely be to engineer additional features to encode each entry’s relationship to its surroundings records, or to make use of a graphical/network representation of the data to ensure relational data between logs is provided in the model’s input.
References
- Hofmann v Jerico Pictures Inc. (2024) Docket No. 0:24-cv-61383-SD-FLA, filed 1 August.
- BBC News (2024) Ransomware attack contributed to patient's death.
- Department for Science, Innovation and Technology (2025) Cyber security breaches survey 2025.
- Department for Science, Innovation and Technology (2025) Cyber security skills in the UK labour market 2025: Findings report.
- NHS England (2024) Synnovis cyber incident.
- National Cyber Security Centre (2025) NCSC annual review 2025.