
Spatial and Ecological Evaluation of Developing Spaces (SEEDS).
The SEEDS project brings together and improves fragmented data about community growing spaces, creating a public dashboard that helps communities, planners and other stakeholders better understand, support and benefit from these spaces.
Project overview
Community Growing Schemes (CGSs), including community gardens, orchards, allotments and informal urban agriculture, represent a key strategy to diversify and localize food production as well as utilise underused urban land.1,2 Often led by grassroots groups, CGSs improve local food and nutrient security by providing access to healthy, sustainable and affordable food sources, particularly for food insecure populations. They strengthen resilience to supply chain disruptions, while helping to democratise and collectivise food systems on a local level.3
Beyond food provision, CGSs deliver wide-ranging social, economic and environmental benefits including: building community relations, increasing food literacy, supporting public health and encouraging waste recycling.1,2,3,4 Green areas in cities provide multiple ecosystem services, from primary services such as the reservoir of nutrients and organic carbon in the soil, to the provision of cultural and recreational services which have wide societal benefits.5,6 CGSs serve as a source of community strength and popular participation in urban planning, helping to build more inclusive, sustainable and climate-resilient cities.3,7
Global soil degradation poses a critical challenge to future food security, with the Food and Agriculture Organization of the United Nations (FAO) estimating that 33% of soils are already degraded and over 90% may be at risk by 2050.8,9 As pressure on agricultural systems intensifies, cities are increasingly recognised as sites for food production. However, urban soils are subject to numerous diverse anthropogenic activities, and may have high levels of pollution, providing a potential exposure pathway for organisms and humans, potentially leading to acute and chronic health effects. Addressing soil pollution is crucial to safeguarding human health and ecological sustainability.1,10 Despite this, data on soil health and CGSs distribution remain fragmented, limiting the ability to assess where food can be safely grown and where interventions are needed.
This study aimed to assess and enhance the impact of CGSs in Leeds, UK, through spatial and statistical analysis. By integrating open-source community and environmental datasets, the project: (1) evaluated the accuracy and completeness of existing formal and informal CGS data; (2) increased the accessibility and utility of CGS data through the development of an openly accessible dashboard; and (3) determined possible sites for establishing new CGS in the city.
By improving reproducible data integration and accessibility, this project facilitates community engagement, supports evidence-based urban planning, and promotes sustainable soil and land management. Ultimately, the project aimed to strengthen local food systems, inform policy and contribute to healthier and more resilient urban communities.
Data and methods
Data collection and preparation
Community Growing Schemes (CGSs) were defined as shared spaces, often open to the public, where people collectively grow food and plants for community benefit and personal use rather than private profit. All data used in the project were obtained from open-source platforms or provided directly by local organisations.
CGSs data were collected and web-scraped from various sources including Ordnance Survey, OpenStreetMap, Leeds Green Activity Provider (LGAP), and Leeds City Council. Additional data were provided by local organisations including Incredible Edible Leeds, Fruit Works Co-Operative, Seasonwell and FoodWise Leeds. The datasets were integrated with local authority and ward boundaries as well as postcode data to enable CGSs to be mapped across Leeds.
As CGSs were sometimes listed in multiple sources, data-cleaning rules were developed to identify duplicates, retain the most appropriate geometry and combine complementary information into a single record. Fuzzy token matching and merged-word matching were used to reconcile variations in CGS names across sources. This process produced a single, cleaned dataset representing existing CGSs in Leeds.
Soil health data were obtained from the UK Soil Observatory (UKSO), UK Government, and British Geological Survey (BGS). Soil health screening values data were derived by combining thresholds from multiple sources and established standards including Normal Background Concentration (NBC), Category 4 Screening Levels (C4SL) and Soil Guideline Values (SGV).
Data layers used in the planning tool were collected from the Office for National Statistics (ONS), Ordnance Survey, OpenStreetMap, Leeds City Council, Healthy and Sustainable Places (HASP) and UK government sources. All datasets were cleaned, processed and integrated into a consistent format suitable for mapping and visualisation in the dashboard.
The GitHub README and the SEEDS dashboard ‘User Guide’ tab provide the full list of data sources and details for each individual layer.
Dashboard development
The SEEDS dashboard was developed using a Python-based Plotly Dash framework, with Leaflet, to create a browser-based interactive application. The dashboard comprises three tabs: ‘Existing Community Growing Schemes’, ‘Imagining Future Growing Spaces’ and ‘User Guide’. The system architecture was separated into the following components:
- Data processing – responsible for collecting, processing and harmonising the datasets required by the dashboard, ensuring that data from different sources could be used consistently.
- Data loading and configuration – responsible for loading the processed datasets and defining the configuration required to make data available consistently across application components.
- Assets – contains visual resources, including stylesheet and image files, that control the application’s appearance and presentation.
- Functions – contain the application logic for processing and displaying data, including map layers, legends and location-based information. Functions also support map interactions, such as site selection, postcode-based navigation and assessment of soil health against relevant screening values.
- Callbacks – control the interactive behaviour of the dashboard by responding to user inputs, triggering functions and updating maps, layers, legends, sidebars, postcode searches and other interface elements.
- Layouts – define the visual structure and organisation of the dashboard, including the three tabs, map layers and checklists, sidebars, buttons and postcode search functionality.
- Main application – acts as the central component, initiating the application and bringing together the layouts, callbacks, functions and data configurations, to form the complete interactive dashboard.
The SEEDS dashboard was co-designed with stakeholders during a mid-project workshop. Feedback on an early prototype informed the selection and presentation of data, map functionalities, interface controls and supporting information, helping to identify features that would be the most useful to end users. Stakeholder priorities were balanced with technical feasibility to develop a practical and accessible tool. A key discussion point of the workshop was ensuring the dashboard remained self-sustaining and up to date beyond the project’s completion.
The dashboard was designed to prioritise usability, accessibility and transparency, enabling users to explore data without unnecessary information overload. Colour-blind-friendly colour schemes were used to improve accessibility, while concise information and links to further resources were provided where additional information was available.
To support user-friendly interaction, pop-up messages are displayed when users first access each tab to explain key interactions and functionality. The ‘User Guide’ tab further explains each tab, its data layers and their sources, helping users interpret the information presented and explore further detail where required.
The codebase was structured modularly to support reproducibility, maintenance and future scalability. The repository is publicly available on GitHub, supporting open research practices and providing further information on the dashboard’s development. The SEEDS dashboard is currently undergoing live deployment on the FoodWise Leeds website.
Key findings
The main outputs of the SEEDS project were the development of the SEEDS dashboard, an open-access online mapping tool designed to support both community engagement and decision making through dedicated engagement and planning tools, as well as a comprehensive, research ready dataset of community growing schemes in Leeds.
Existing Community Growing Schemes
The engagement tool, provided through the ‘Existing Community Growing Schemes’ tab of the dashboard, enables users to explore existing Community Growing Schemes (CGSs) across Leeds. Users can display five different types of CGSs (allotments, community growing spaces, community orchards, urban farms and composting collectives) and select multiple schemes simultaneously.
Selecting an individual CGS opens a sidebar providing:
- Community information: including the scheme’s location, activities, meeting times and places, and contact details, where available.
- Soil Health information: summarising available soil health data for the scheme area to provide an indication of local growing conditions.
This engagement tool improves the visibility and accessibility of existing CGSs, helping residents discover local opportunities and learn about nearby schemes. By making information on CGSs and local soil conditions more accessible, it supports participation in existing schemes, strengthens connections between residents and organisations, and has potential to reduce exposure to contaminated soils.
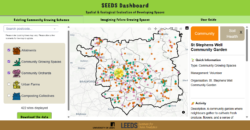
Figure 1. Screenshot of the ‘Existing Community Growing Schemes’ tab of the SEEDS dashboard.
Accessible description: The figure shows the ‘Existing Community Growing Schemes’ tab of the SEEDS dashboard. At the top is a header displaying the title ‘SEEDS Dashboard. Spatial and Ecological Evaluation of Developing Spaces’, followed by three tabs: ‘Existing Community Growing Schemes’, ‘Imagining Future Growing Spaces’ and ‘User Guide’. The ‘Existing Community Growing Schemes’ tab is selected.
On the top left, a postcode search bar allows users to locate an area on the map. Below it, a checklist allows users to select one or more of five Community Growing Schemes (CGS) types: allotments, community growing spaces, community orchards, urban farms and composting collectives. Each type is represented by an icon and colour, using a colour-blind-friendly scheme. In the screenshot, the first three CGS types are selected. A text indicator below the checklist shows the number of CGSs displayed based on the selected categories, followed by a ‘Download the data’ button for downloading the underlying data as a CSV file.
The main area of page contains an interactive map of Leeds, with the local authority and ward boundaries shown in black. Coloured points and polygons indicate the selected CGS types. One CGS is selected, indicated by a yellow halo, and a sidebar is open on the right side, displaying information about the selected scheme.
Imagining Future Growing Spaces
The Planning Tool, provided through the ‘Imagining Future Growing Spaces’ tab of the dashboard, enables users to explore where future Community Growing Schemes could potentially be developed across Leeds. The tool brings together spatial data on soil health, potential toxic elements, flood risk, socio-demographics, brownfield sites and existing CGSs, allowing users to consider soil health, environmental conditions and local community needs when exploring potential sites.
Users can search for a specific area using the postcode search bar and explore individual data layers using the checklist. Only one layer can be selected at a time, allowing users to select a location anywhere on the map and toggle between the different layers to get information about the specific location. Selecting a location on the map opens a sidebar providing more detailed information about the selected layer and location.
By bringing these datasets together, the Planning Tool supports the identification of underutilised land with the potential for future CGSs, particularly in areas they could benefit food insecure populations, providing an evidence base for sustainable urban planning and supporting the right to grow in the city.
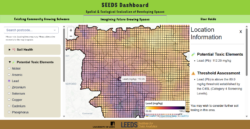
Figure 2. Screenshot of the ‘Imagining Future Community Growing Spaces’ tab of the SEEDS dashboard.
Accessible description: The figure shows the ‘Imagining Future Community Growing Spaces’ tab of the SEEDS dashboard. At the top is a header displaying the title ‘SEEDS Dashboard. Spatial and Ecological Evaluation of Developing Spaces’, followed by three tabs: ‘Existing Community Growing Schemes’, ‘Imagining Future Growing Spaces’ and ‘User Guide’. The ‘Imagining Future Community Growing Spaces’ tab is selected.
On the top left, a postcode search bar allows users to locate an area on the map. Below it, a checklist allows users to select different data layers. In the screenshot, the ‘Potential Toxic Elements’ category and the ‘Lead’ layer are selected. Only one data layer can be displayed at a time.
The main area of the page contains an interactive map of Leeds, with the local authority and ward boundaries shown in black. A colour gradient represents soil lead concentrations, with the legend in the bottom right showing the colour scale and minimum and maximum values. A location has been selected on the map, opening a sidebar on the right side that displays the lead concentration at the selected location. The sidebar also indicates that the concentration exceeds the Category 4 Screening Levels and provides advice to undertake soil testing.
User Guide
The ‘User Guide’ tab of the dashboard provides information about the SEEDS project and team, and explains the data layers, sources and methods used in the dashboard. It also directs users to further information and resources where available.
Video Demo – Walkthrough of the tool
Watch this screen recording demonstration illustrating how the SEEDS dashboard works.
Watch the video demoValue of the research
The SEEDS project provides an accessible and dynamic evidence base to support communities, organisations and decision-makers in understanding where food is currently being grown, key local soil properties, and where there may be opportunities for new community growing spaces across Leeds. By bringing together information on existing CGSs, soil health, environmental conditions and local communities, the dashboard connects information that is often held across different sources and provides a shared basis for engagement and decision-making.
The SEEDS dashboard can be used to:
- Explore Community Growing Schemes (CGSs) across Leeds, including allotments, orchards and other growing projects.
- Learn about local soil health and identify areas where soil may need further investigation or improvement.
- Explore potential locations for future community growing spaces.
- Understand local communities and their needs using information about population and local areas.
- Support planning and decision-making around green spaces, food growing and land use.
The dashboard uses reproducible methods to remain accessible, dynamic and updateable, supporting its continued use beyond the project. Rather than providing a static map of existing CGSs, SEEDS thus provides a living evidence base that can evolve with the community growing landscape and support the development of future growing spaces.
The SEEDS project therefore has the potential to contribute to:
- Healthier urban environments
- Empowered local communities
- Stronger local food resilience
- Better soil management and nature recovery
- Evidence for sustainable urban planning and policy
- More equitable access to growing schemes
What our partners said...
"This project has been a really good development of the work that has already happened in Leeds around mapping and food / nature projects, it has been great to see how they have used existing community generated data and added other layers and insights, we hope this will be useful tool for the future"
Pete Tatham, Project Director, Hyde Park Source
"It has been a great opportunity to co-produce the SEEDS dashboard, which is a valuable asset to support community food growing in Leeds. With the changing weather patterns, rising food prices and the desire for greater community cohesion, the SEEDS dashboard not only shows existing growing sites but can be used to identify new areas for community food growing. This is important for creating a more resilient local food system for Leeds."
Sonja Woodcock, FoodWise Leeds
Insights
- Developed an open-access dashboard integrating community growing, environmental and socio-demographic data across Leeds.
- Integrated fragmented datasets into a single, accessible evidence base for community engagement and sustainable urban planning.
- Created a cleaned dataset of existing Community Growing Schemes (CGSs) across Leeds.
- Developed a tool designed for long-term use, with potential to be updated and maintained beyond the project.
- Future development should include a user submission system, enabling communities to add new schemes and update existing information.
Team
- Marion Carneiro, Data Scientist, Leeds Institute for Data Analytics, University of Leeds
- Dr Rachel Olroyd, Lecturer in Spatial Data Science, School of Geography, University of Leeds
- Dr Fran Pontin, Lecturer School of Geography, Senior Research Fellow, School of Law, University of Leeds
- Dr Asa Roast, Lecturer in Urban Geography, School of Geography, University of Leeds
- Dr Laura Carter, Professor of Environmental Chemistry, University of Leeds and UKRI Future Leaders Fellow
- Dr Myles Gould, Associate Professor, School of Geography, University of Leeds
Partners
- FoodWise Leeds
- Hyde Park Source
Funder
This project was supported by ESRC Impact Accelerator Account funding at the University of Leeds.
This work has been facilitated by the Leeds Institute for Data Analytics (LIDA) Data Scientist Development Programme, which employs early-career data scientists to deliver real-world data-driven impact in the interests of the public good.
References
- Orsini, F. et al. .2013. Urban Agriculture in the developing world: A Review. Agronomy for Sustainable Development. 33(4), pp. 695–720. doi:10.1007/s13593-013-0143-z.
- Milbourne, P. 2021. Growing Public Spaces in the city: Community Gardening and the making of new urban environments of publicness. Urban Studies. 58(14), pp. 2901–2919. doi:10.1177/0042098020972281.
- Jensen, P.D. and Orfila, C. 2021. Mapping the production-consumption gap of an urban food system: An empirical case study of food security and resilience. Food Security. 13(3), pp. 551–570. doi:10.1007/s12571-021-01142-2.
- Royal Horticultural Society. October 2025. Realising the potential of the Community Gardening Movement. Available at: https://www.rhs.org.uk/get-involved/community-gardening/documents/resources/spacetogrow.pdf [Accessed: 14 September 2026].
- Pradhan, P. et al. 2023. A systematic review highlights that there are multiple benefits of urban agriculture besides food. Global Food Security. 38, p. 100700. doi:10.1016/j.gfs.2023.100700.
- Eldridge, D.J. et al. 2024. Urban greenspaces and nearby natural areas support similar levels of Soil Ecosystem Services. npj Urban Sustainability. 4(1). doi:10.1038/s42949-024-00154-z.
- Wadumestrige Dona, C.G., Mohan, G. and Fukushi, K. 2021. Promoting urban agriculture and its opportunities and challenges—a global review. Sustainability. 13(17), p. 9609. doi:10.3390/su13179609.
- FAO and ITPS. 2015. Status of the World’s Soil Resources (SWSR) – Main Report [Online]. Food and Agriculture Organization of the United Nations and Intergovernmental Technical Panel on Soils, Rome, Italy.
- IPBES. 2018. Summary for policymakers of the assessment report on land degradation and restoration of the Intergovernmental SciencePolicy Platform on Biodiversity and Ecosystem Services. R. Scholes, L. Montanarella, A. Brainich, N. Barger, B. ten Brink, M. Cantele, B. Erasmus, J. Fisher, T. Gardner, T. G. Holland, F. Kohler, J. S. Kotiaho, G. Von Maltitz, G. Nangendo, R. Pandit, J. Parrotta, M. D. Potts, S. Prince, M. Sankaran and L. Willemen (eds.). IPBES secretariat, Bonn, Germany. 44 pages.
- Crispo, M. et al. 2021. Heavy metals and metalloids concentrations across UK urban horticultural soils and the factors influencing their bioavailability to food crops. Environmental Pollution. 288, p. 117960. doi:10.1016/j.envpol.2021.117960.