Synthetic Population Estimation and Scenario Projection – The English Future Elderly Model
Luke Archer, Dr Nik Lomax, Prof Stephane Hess - University of Leeds; and Bryan Tysinger - University of Southern California
We have adapted a model that can project the health trajectories of the English future elderly population, as well as test policy interventions into the future.
Project overview
The phenomena of population ageing is being seen in virtually all developed and developing nations around the world. There are many knock-on effects to population ageing, particularly in the management of the healthcare and welfare systems, as well as wider impacts on the economy as a whole. Therefore, tools to help policy makers assess the long term impact of their decisions on the future elderly are increasingly important. Our aim has been to adapt an already established tool of this type developed at the University of Southern California (USC) – the Future Elderly Model (FEM).
Data and methods
The project resulted from a collaboration between Dr. Nik Lomax and Professor Stephane Hess at the University of Leeds, and Bryan Tysinger at USC. Bryan and his team at USC have been developing the FEM for over a decade, to attempt to answer some important questions regarding the future of health in the US.
The FEM is a dynamic data-driven microsimulation model. This means that each individual unit (i.e. person) is treated as an autonomous entity and simulated separately from one another. This is in contrast to many other modelling techniques, where it is common to aggregate data and investigate generalised trends. Microsimulation in health sciences allows us to generate individual life histories, where forecasting a relatively small group of people can be used to project much larger population trends.
Longitudinal health surveys are used as the host data for the model. Transition probabilities can then be estimated using the survey data for each variable for every person. These probabilities are then applied between each wave of the simulation, transforming (or not) the state of an individual. For example, the model will look through the host data to find information on Diabetes for each individual at every wave. When an individual’s disease state changes (from no disease to having Diabetes), the model investigates a number of related predictor variables. It then uses the previous information to calculate the probability of the disease state changing, based on this related information.
The US model uses the Health and Retirement Study (HRS) as its host data. The HRS is a high quality longitudinal survey that has been running since 1992, which includes a wealth of information on a respondent’s health, employment, welfare, and financial status.
In adapting the model to an English context, the first step was to find a comparable data set to use as host data. In England, the English Longitudinal Study of Ageing (ELSA) was developed to mimic the HRS and allow comparison. It is very similar in terms of the information collected, but has some significant differences. For example, the HRS collects detailed information on medical expenditure, whereas ELSA does not.
Starting with the ELSA dataset, the first step was to ‘harmonize’ the data. Harmonization is the process of linking the data for a single person over each wave. It allows us to easily investigate the change in an individual’s state over the length of the survey. The Gateway to Global Ageing Data group (based also at USC) maintain a harmonization script written in Stata, the statistical computing language.
Once harmonized, we reshaped the data and produce 3 populations that the model requires. The ‘stock’ population – the population that will be simulated from the start of the model. The ‘replenishing’ population – a cohort of 51 and 52 year olds that we integrate at each new wave, to replace the 51 and 52 year olds that were aged between waves. Finally, the ‘transition’ population – the population we use to estimate the transition probabilities through different forms of regression analysis.
With the input populations produced and the transition probabilities estimated, we can begin the simulation. The structure of the model is shown in Figure 1.
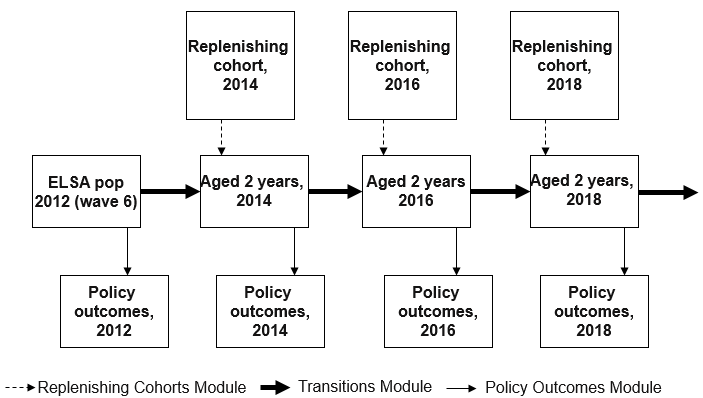
Figure 1. Structure of the FEM simulation.
We start the simulation in 2012, at wave 6 of ELSA. First we take policy outcomes from 2012, which have not yet been simulated and so simply represent trends from the input data. We then start the simulation and age the population by two years, applying the transition probabilities and changing the state of some individuals. After replenishing the now missing 51 and 52 years olds, we take policy outcomes, this time showing the results of the simulation. We then repeat this process for as long as we wish to simulate, investigating policy outcomes at the end or at each wave.
One of the powerful features of the model is the ability to run interventions to investigate how specific changes affect the projection. These “What if?” questions could mimic a policy change, or a new preventative treatment for a disease. For example, we could ask if the retirement age is changed from 65 to 70, how would this affect the health of our simulants?
Key findings
Our main goal for this research project was to produce simulations using English input data. We have achieved this, and the model is working well for this purpose. We have, however, identified some issues with the model which need to be handled before the results can be trusted.
To test our implementation of the FEM, we ran some experiments. Firstly, we wanted to investigate the incidence and prevalence in a cohort of three chronic diseases – Diabetes, Cancer and Heart Disease. We projected a cohort of 51 and 52 years olds forward from 2012 to 2060. Figure 2 shows the proportion of people that began the simulation with one of the chronic diseases, as well as the proportion of people that ended the simulation with one.
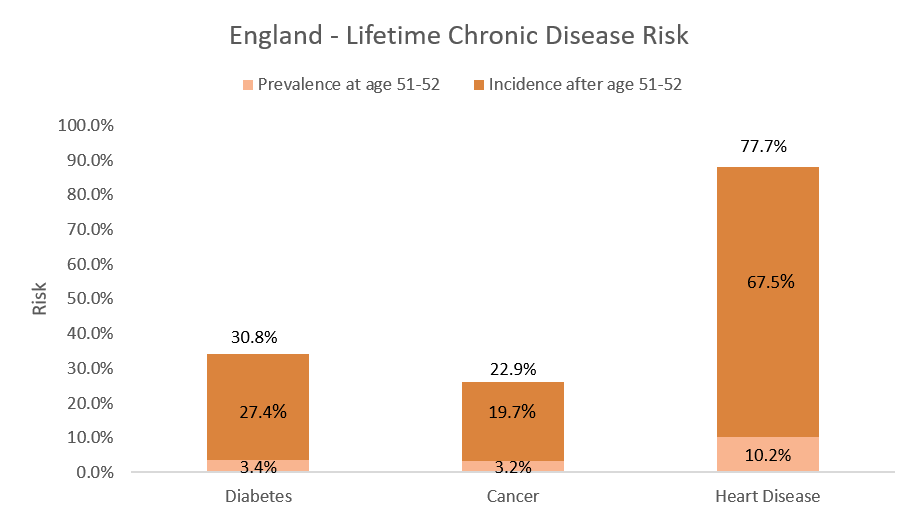
Figure 2. The light orange bars show the prevalence of the three chronic diseases at age 51-52 (before the simulation started), and the dark orange bars show the incidence after age 51-52 (those who developed a chronic disease during the simulation).
We then ran another experiment to test our interventions, or “What if?” questions. We investigated what would happen if we applied a hypothetical treatment/policy change that affected the incidence of Diabetes. We lowered the incidence by 10%, 50%, and 100%, as well as the baseline case to act as a control. The results are shown in Figure 3.
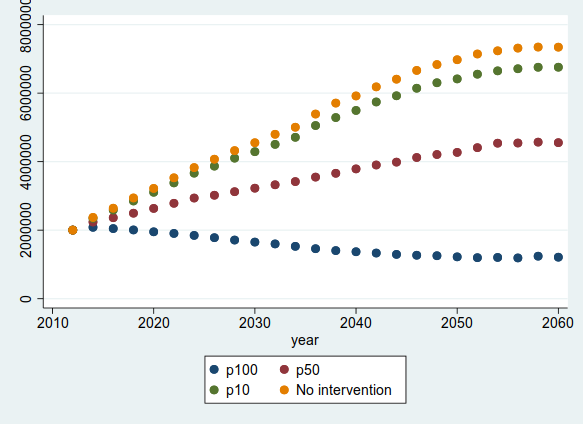
Figure 3. This graph shows the number of people with Diabetes in four separate simulation runs, ranging from the baseline case (no intervention - Yellow) as well as a 10% (Green), 50% (Red), and 100% (Blue) reduction in incidence.
Value of the research
The goal of this research is to develop a tool that can model the future health trajectories in the UK elderly population, as well as test the impact of policy intervention. The ability to track future health trajectories will help to plan investment and resource allocation, which is important for healthcare providers and government. Also, national and local policy makers would benefit from being able to test policy decisions before implementing them, enabling them to make an evidence based decision.
Insights
- Population ageing is seen in virtually all developed and developing nations
- Tools that can predict information about the future elderly are important for planning
- The English FEM can predict future health trajectories, but also assess the impact of policy changes.
Research theme
Health Informatics.
This project was undertaken as part of the LIDA Data Scientist Internship Programme.