
The Hour of Need: The Illusion of Time
In partnership with Energy UK
For 23 years, Adam taught Chemistry at John Marks High School in Holbeck, a community 20 minutes away from Leeds City Centre, before his retirement. He currently lives with his wife, Elsbeth (Mrs. Adam), who has been a homemaker since they married in 1987, and they enjoy each other’s company while living on Adam’s retirement benefits. As occupants of a two-room council-rented apartment in Beeston Hills, the couple live a structured and busy routine throughout the day. At exactly 8:00 am every morning, the calm whistling sound of the kettle sings through the walls of the kitchen as it boils water for tea. Then comes the microwave oven’s swooshing sound at 8:30 am. At 10:00 am they both sit in their separate armchairs, listening to BBC News at Ten, while sipping from their fourth cups of tea. They structure their activities in such a way that they remained engaged throughout the whole day, and into the evening.
On a cold winter Monday morning, on his way to the nearest grocery shop, 10 minutes away by bus, Adam read The Sun newspaper, which he picked had up on the ‘First Bus.’ It reported the UK government’s plan to implement a reform that would allow energy users to pay less if they were able to move some of their energy-using activities to the non-peak times, or periods when there is less demand. Called the Market-wide Half-Hourly Settlement (MHHS) reform, the government estimates that this reform would help electricity consumers across the UK to save up to £4.5 billion by 2045. Previous studies have examined how consumers can benefit from the reform, identifying flexibility and availability as key factors; Adam imagined that since he and Elsbeth were usually at home, this would be easy, but he was unsure.
Just like Adam and Elsbeth, some families across the United Kingdom could benefit from this side of the policy, but it is not definitive, based on mere observation of availability, who may be disadvantaged or at risk under this reform. Hence, the Hour of Need project aims to identify these households by exploring the behavioural patterns of electricity consumers (whom I will refer from now on as energy consumers or users) and their locations by answering the following questions:
- Can we use time-use survey data to characterise households by their energy using activities?
- Can we use smart meter data to determine energy profiles of these households?
- Can we identify the types of households who are at risk from the ‘Settlement Reform’?
- Using the household characteristics data from the 2021 UK census, can we work out which neighbourhoods have the highest concentration of ‘at-risk’ households?
Through these questions the project focuses on identifying the geography of the communities where the ‘at-risk’ households are prevalent, to ensure that they are protected from future smart electricity tariffs, so that they can benefit from demand reduction. This will arm policymakers with informed insights to ensure the implementation of the MHHS reform does not reinforce inequality among UK residents.
Before I tell you what we found, let me first explain what we did.
Data, Methods, Limitations, and Assumptions
We leveraged the time-use survey data and the SERL (Smart Energy Research Lab) smart meter records from the UK Data Services, which were all anonymised. The time-use survey is an annual survey of randomly selected households across the United Kingdom. We used the 2023 survey, which contained over 2000 nationally representative households across the UK with information on several activities they carried out indoors and those outdoors, the time of use, and the demographic details of the households, such as age, employment, annual household income, housing tenure. The SERL smart meter data contained the records from electricity meters from 13,000 nationally representative households who are participating in building a database for energy research. It contained separate data on participants’ demographics, over 800 million 30-minute smart meter readings between 2019 and 2024, tariff records from 2020 to 2024, and climate conditions from 2020 to 2024.
These two datasets were intended to provide insight into the cost implications of rigidity. Starting with the time-use data, we resampled the data into 30-minute time bins to compute the exact duration each household spent on an activity within any 30-minute period, namely, laundry, dishwashing, food preparation, watching TV, heating, washing & dressing, and cleaning house during weekdays. Unsupervised machine learning model, K-Medoid, was applied to the resampled data, running several clustering possibilities between 2 and 20 in the silhouette test to determine the best household group archetypes. The best clustering was observed at 19, which pointed to 19 household archetypes. A flexibility measure for each household group was computed using the load factor concept, which is defined as the ratio of average peak within a period to the maximum peak within the same period. The load factor provided insights on how households engage in their activities, namely, consistently or momentarily across the 48 half-hours of the day.

Figure 1: Study Approach
The model was evaluated by testing predictability of cluster memberships and model stability. We applied Random Forest to test predictability, achieving 98.8%, while the adjusted rand index (ARI) evaluated model stability, performing moderately (ARI 0.583 ± 0.066). The ARI performance increased with the number of clustering runs, but posed a granularity challenge, leading to a trade-off, and choice for 19 clusters. In addition, Chi-squared and Kruskal-Wallis tests were applied to test statistical association of the features, revealing that all the features were statistically associated (p < 0.001) with the behavioural patterns.
A flexibility measure was computed for each household cluster group at several periods of a day, which include the day window (7:00 am to 3:59 pm), evening peak window (4:00 pm to 10:59 pm), and off-peak window (11:00 pm to 6:59 am). These aligned with the UK tariff rate windows (which may differ among electricity suppliers) and gave an idea of which households were potentially rigid at these periods. Descriptive analysis of the demographic features of the clusters provided insight into the make-up of each cluster, and leveraging the representation ratio, we determined the over- and under-represented household demographic features within each group, using this to characterise household clusters.
While the time-use data was intended to be integrated into the SERL smart meter data, the non-descriptiveness of the activities that make up the energy consumptions in the SERL data made it difficult. This led to handling the smart meter data separately, applying the same process used for the time-use data. Instead of using the data from 2019-2024, we used the 2023 SERL smart meter data given that the large volume made the notebook on the virtual secured environment to ‘die.’ In the place of K-Medoid, K-Means was applied due to restrictions on installing additional packages in the trusted research environment. Tariff data was then linked, and consumption was predicted using the 2023 SERL meter readings.
Other limitations from the datasets included:
- Respondents’ targeted questionnaire: majority of demographic information on the time use data were aimed at the respondents, rather than the households. For instance, respondents were asked about their employment status, and in cases where they were not working, the employment status of the chief income earner were requested. We leveraged this two information to theorise the employment categorisation of households.
- Limited timing for survey: the time-use survey methodology allowed each household only 48 hours of activities. While our work explored only weekdays, this limited timeframe makes it difficult to conclude on whether observed flexibility during weekdays could be because of rescheduling of activities to weekends.
- Missing mapping features in the time use data: the time use survey data, although gave a better navigation for this work, did not have mapping features such as Indices of Multiple Deprivations or Lower-layer Super Output Area (LSOA) indicators. These were only available in the smart meter data, which leaves the smart meter data with the possibility of mapping using these details.
- Data missingness: demographic features of the SERL data were heavily missing owing to semi-free text involved in the survey questions, where one could choose not to answer an entire question. We considered these non-answers as zero since they were choice based.
As at the time of this output, the time-use data have not been successfully linked to the smart meter data, owing to the limitations mentioned above. The next section summarises the findings from only the time-use survey data on how people’s engagement could potentially make them at risk of the reform.
Key findings
Two household groups showed a higher level of rigidity across the whole day and times people are active to carry out activities. These are household cluster groups 9 and 13, which make up 8.32% of the sample.

Figure 2: Household Groups Flexibility Comparison
The most common features among these two groups include a high presence of small-sized, partly retired, and low-income households without children. While household cluster 9 housing tenure are rentals from council, private landlords, and third parties, household cluster 13 are highly populated by outright homeowners. These suggest that households where people are home-staying spend more time engaging in energy-using activities across the different peak and non-peak windows. It was observed that their sustained engagement continues from the day windows and into the evening peaks, when they reduce participation (refer to figures 3 and 4). This becomes a behavioural challenge, as this type of routine makes it difficult to accommodate or alter activities transitioning to periods of the day.

Figure 3: Household Cluster 9 Activity Engagement Throughout the Day
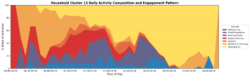
Figure 4: Household Cluster 13 Activity Engagement Throughout the Day
Insights on the most rigid activities showed that dishwashing and food preparation are the most rigid activities in the day period for household cluster 9, while home heating and laundry were most rigid for household cluster 13. The evening peaks showed that both groups were less flexible with dishwashing and washing & dressing.
In comparison to the flexible household groups, such as household cluster 8, which is made up of very high-income, medium-sized households with under 16 years children, who are mortgage and shared homeowners. These are particularly partly employed households where working members have remote and onsite work patterns. Their activity engagement showed narrowed peaks and dips before the evening peak windows, which suggests momentary engagement with energy-using activities during work times, but not during evening peak hours. The momentary engagement style of flexible households before the evening peak allows them to save time and potentially reduced costs of energy use, but these are not flexible across periods, as their engagements are longer in the evenings (refer to figure 5 below). This suggests that their working patterns of onsite or remote draw them to do most of their activities during the evenings.

Figure 5: Household Cluster 8 Activity Engagement Throughout the Day
This does not rule out the fact that when people are working onsite or remote, their work becomes an external factor that could make them reschedule activities to weekends. For instance, tiredness after work could lead to delegating activities such as laundry to weekends, reducing participation during the day and evening window of the weekdays. Since our work focused on the weekdays, there is a need to include weekend contexts before conclusions are drawn.
Dishwashing and food preparation are activities that could produce high rigidity during the day engagement windows, while dishwashing and washing & dressing reproduce the same in the evening peak for flexible households. Notwithstanding the working pattern, they maintain the same brief engagements with these activities.
Study Significance, Implications, and Open Directions
Recall Adam’s thought that home-staying could afford him avenues to take advantage of the reform. Our findings suggest that being home staying does not directly translate into flexibility. In fact, it can make one stay longer with activities which could potentially lead to high tariffs. For families such as Adam and Elsbeth, whose routines are continuous, the idea of ‘time wealth’, if not checked can lead to disadvantages. This information provides an opportunity to review and improve on their ways of engaging in energy-using activities.
While conversation on the commencement of the MHHS reform is ongoing, this study situates the equity element required ensure inclusive reform implementation. Suppliers and policymakers can leverage insights from this study to develop and implement a targeted behavioural programme for people like Adam and Elsbeth, living at different locations across the United Kingdom, which will enable them to adjust their pattern of usage, ensuring that much of their income is not used for paying electricity bills. Where change is inevitable, such as households with senior residents that depend on constant use of electricity for health conditions, of which in the absence of electricity could cause cardiovascular or respiratory damage, energy suppliers could work out discounted tariffs for support. Possible adjustment in the pattern of use by less flexible households will reduce pressure on the grids at peak periods, which usually lead to increasing carbon emissions. This will enable the sector and the government to achieve efficiency in energy distribution while meeting the net zero targets.
While this work remains a proof of concept on determining vulnerable energy users, who we are currently working out their geographic location, it opens several directions for further research, including:
- comparing weekend engagement with weekdays to provide understanding on whether rescheduling activities to weekends leads to the flexibility observed by flexible household groups at weekdays.
- improving data collection of energy demand and usage data that utilises similar populations and activity categorisations, which would allow effective econometrics on the consumptions of usage. This will enable appropriate insights on whether sustained engagement with activities for less flexible households is equal to a high cost of electricity.
Insights
- Availability and flexibility are not synonymous in energy use.
- Low income, retired, small-sized households (8.32%) have more rigid activity engagement patterns.
- Households cluster groups where members are working onsite or remote show improved flexibility across the day.
- Rigidity in time use are behavioural and introducing programmes aimed at this will ensure an equity-driven Market-wide Half Hourly Settlement reform implementation.
Definitions
- Small-sized households: households with 1-2 members
- Medium-sized households: households with 3-5 members
- Large households: households with 6 members and above
- Fully retired households: all members are retired
- Partly retired households: at least one member is retired
- Partly employed households: at least one member is working
- Fully employed households: all members are working.
Project Team
- Emeka Onyebuchi Enechukwu (Buchi), Data Scientist, Leeds Institute for Data Analytics, University of Leeds
- Dr. Anne Owen (Lead Supervisor), Associate Professor, School of Earth, Environment and Sustainability, University of Leeds
- Dr. Steve Hall (Co-Supervisor), Senior Industry/Business Research Fellow, Environment and Geography, University of York
Funder
The research is supported by the Energy Demand Research Centre (EDRC), supported by the Engineering and Physical Sciences Research Council and the Economic and Social Research Council [grant number EP/Y010078/1].
This work has been facilitated by the Leeds Institute for Data Analytics (LIDA) Data Scientist Development Programme, which employs early-career data scientists to deliver real-world data-driven impact in the interests of the public good.
References
- Elexon. (2026). Delivering outcomes to support a more cost-effective electricity industry. MHHS Programme
- Energy UK. (2024) Energy UK Explains: Market-wide Half Hourly Settlement. Energy UK Explains: Market-wide Half Hourly Settlement
- Lőrincz, M. J., Ramírez-Mendiola, J. L., & Torriti, J. (2021). Impact of Time-Use Behaviour on Residential Energy Consumption in the United Kingdom. Energies, 14(19), 6286.
- Matthew L., David, A., & Miaomiao, H. (2018). Seasonal variation in household electricity demand: A comparison of monitored and synthetic daily load profiles, Energy and Buildings, Volume 179, Pages 292-300.
- McLoughlin, F., Duffy, A. & Conlon, M. (2013). Evaluation of time series techniques to characterise domestic electricity demand. Energy, vol.50, pp. 120-130. doi:10.1016/ j.energy.2012.11.048.
- Torriti, J., and Yunusov, T. (2020). It’s only a matter of time: Flexibility, activities and time of use tariffs in the United Kingdom. Energy Research & Social Science, Vol 69, pp. 3-7.