
Towards a Geospatial Foundation Model for Mobility
In partnership with Geolytix
Project Overview
Every day, millions of people move through cities in patterns so routine that we barely notice them. Understanding and predicting human mobility is central to urban analysis, city planning, transport and land-use management, and a wide range of applications in public policy, business location research, commercial site selection, retail network planning, and public service delivery. However, existing mobility models remain purpose-built and context-specific, limiting scalability across cities and regions. Classical gravity models provide interpretability but struggle with complex spatial dependencies (Simini et al., 2021), while activity-based approaches demand extensive local data and behavioural assumptions (Yeghikyan et al., 2020). Recent deep learning models for mobility prediction face challenges in generalising across cities and time periods, and struggle with zero-shot generalisation, that is, predicting movement patterns for locations that were not seen during training (Hashemi and Zufle, 2025). These limitations highlight the need for more generalisable representations of urban mobility. Recent work has pursued similar goals using unsupervised learning on GPS trajectory data (Zhang et al., 2024b).
Recent advances in artificial intelligence have produced foundation models, which are large-scale, task-agnostic systems pre-trained on diverse data and adaptable via fine-tuning or few-shot learning (Bommasani et al., 2021; Zhang et al., 2024a). While transformative for language, computer vision, and earth observation, comparable approaches remain relatively underexplored in the context of geospatial mobility data (Zhou et al., 2024). Geospatial data are inherently diverse and multimodal, spanning maps, texts, and graphs, all widely employed to advance the understanding of urban areas. Despite growing datasets such as FSQ-19M (Hashemi, Amiri and Zufle, 2025) and existing geospatial foundation models such as AlphaEarth and Prithvi (from NASA/IBM), a unified foundation model for geospatial mobility remains underdeveloped. This project represents an exploratory step towards building a geospatial foundation model for mobility to address that gap. The central question is whether representations derived from mobility structure, specifically commuting patterns, can reliably capture underlying urban socio-demographic characteristics.
Data & Method
Data Sources
- UK Census 2021 Origin-Destination (OD) journey-to-work flows (Output Area level), sourced from the Office for National Statistics, used for both the Leeds and London configurations.
- Lookup file mapping Output Areas to Lower Layer Super Output Areas (LSOA) (May 2025 edition).
- National Origin-Destination flow matrix derived from anonymised GPS-based location data collected across England. The dataset aggregates stay-point detections into home and activity locations to produce a Middle Layer Super Output Area (MSOA)-level OD matrix of population movements (Zhong et al., 2025).
Shared Reference & Feature Data
- Points of Interest (POI) data at LSOA level, covering eleven functional categories.
- Index of Multiple Deprivation 2025 (IMD) at LSOA level.
- LSOA residential population data (2021).
- LSOA and MSOA population-weighted centroids (2021, Ordnance Survey National Grid coordinates).
Data Processing Pipeline
All three datasets follow the same core processing pipeline. For the Census Origin-Destination (OD) flows, raw journey-to-work records were aggregated to LSOA level using a lookup dictionary; remote workers and those with no fixed place of work were excluded to focus on meaningful commuting relationships. The Zhong et al. national OD matrix was already aggregated to MSOA level at source, so no OA-to-zone aggregation was required. Across all three datasets, self-loops (flows where origin and destination fall within the same zone) were removed, and flow counts were log-transformed (log1p) to reduce skewness. For the Census Leeds configuration, flows were further filtered to retain only intra-city OD pairs where both zones fall within the Leeds local authority boundary; an analogous filter was applied for London. The same downstream modelling pipeline was then applied identically to all three resulting flow graphs.
Node Feature Construction
Node features were constructed using Point of Interest (POI) data aggregated at the LSOA level. Individual POIs were mapped to broader functional groups using a custom lookup table that assigns each venue type from the POI source data to one of eleven predefined categories: Food & Drink, Retail, Leisure & Sport, Beauty & Personal, Professional, Health, Education, Auto, Nature & Outdoor, Religion, and Accommodation. For each LSOA present in the commuting network, the number of POIs in each category was counted to form a feature vector. The resulting feature matrix therefore represents each LSOA by the distribution of amenities within it. POI counts were normalised and aligned with the zone ordering used in the commuting network.
Feature-based Model
A feature-based model inspired by the principles of gravity modelling served as the interpretable classical baseline across all three datasets. In the classical gravity model, flows between places are understood as a function of their relative attractiveness and the distance between them. Consistent with this framework, the feature-based baseline uses POI counts as a proxy for zone attractiveness and incorporates distance as a measure of spatial deterrence. For downstream socio-demographic inference, normalised POI counts are supplied as features to a Linear Regression model for population prediction and a Random Forest Classifier for IMD decile prediction. These models operate without graph structure and represent a feature-engineering-only baseline against which graph-based approaches can be compared across Leeds, London, and the national dataset.
Deep Graph Infomax (DGI)
The DGI model learns zone-level representations in a self-supervised manner by maximising mutual information between local node embeddings and a global graph summary, without requiring labelled training data (Veličković et al., 2019). A two-layer Graph Convolutional Network (GCN) encoder maps each zone from its input feature space into a 64-dimensional embedding. Training optimises a contrastive binary cross-entropy loss, which encourages alignment between true node embeddings and the global graph summary while separating embeddings derived from corrupted inputs. Commuting flow volumes, incorporated as edge weights during message passing, allow the encoder to weight neighbourhood aggregation by the strength of connections between zones. The same architecture and training procedure is applied identically across all three datasets. Downstream Evaluation
All three configurations are evaluated on the same two downstream tasks using an 80/20 train-test split with a fixed random seed for reproducibility:
- Population inference: Linear Regression predicting residential population (LSOA or MSOA) from model representations, evaluated using the R² coefficient of determination.
- IMD decile classification: Random Forest Classifier predicting the IMD deprivation decile (1–10), evaluated with accuracy and weighted F1 score, a standard classification metric that balances precision and recall, with the weighted variant accounting for class imbalance across deprivation deciles.
A third structural validation task (flow prediction) is also applied across all datasets, combining the DGI embeddings of each OD pair with the log-transformed distance between them to predict OD flows between zone pairs. This tests whether the learned representations capture genuine mobility structure, regardless of data source.
Key findings
|
Model |
Leeds | London | National | |||
| Population (R2) | IMD Accuracy |
Population (R2) | IMD Accuracy |
Population (R2) | IMD Accuracy |
|
| Feature-based Model |
0.0811 |
0.1837 |
0.0687 |
0.1271 |
0.1809 |
0.1294 |
|
DGI |
0.0642 |
0.1938 |
0.0892 |
0.1832 |
0.1837 |
0.2333 |
Table 1: Comparison of Feature-based Model and DGI Embeddings on Socio-demographic Inference Tasks (Population R² and IMD Decile Accuracy) across Leeds, London, and National Datasets

Figure 1: Bar chart comparing DGI and Feature-based Model performance on Population Inference (R²) and IMD Decile Classification (Accuracy) across Leeds, London, and National Datasets.
Across most configurations and socio-demographic tasks, DGI embeddings yield higher predictive accuracy than the feature-based baseline. For London and the national dataset, DGI consistently outperforms on both tasks. For Leeds, DGI improves IMD classification accuracy but shows a marginal underperformance on population inference, likely reflecting that residential population is not strongly encoded in the commuting graph structure of a compact, relatively homogeneous city with only 488 zones. Absolute scores remain modest across all three datasets, indicating that mobility flows and POI features provide only a partial signal for these outcomes at zone level. This is expected at this exploratory stage and motivates richer feature engineering and additional data modalities in future iterations.
| FLOWS PREDICTIONS | Leeds | London | National |
|
Feature-based Model (Population +Distance) |
0.128 |
0.061 |
0.405 |
|
DGI (Embedding + Distance) |
0.459 |
0.235 |
0.417 |
Table 2: OD Flow Prediction Performance (R²) for Feature-based Model (Population + Distance) and DGI Embeddings (Embedding + Distance) across Leeds, London, and National Datasets
The flow prediction task validates that learned embeddings encode the mobility graph structure across all three data sources. DGI embeddings yield R² values of 0.459 (Leeds), 0.235 (London), and 0.417 (national dataset) each substantially above their respective feature-based model baselines of 0.128, 0.061, and 0.405.
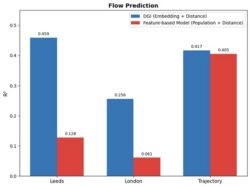
Figure 2: Bar chart comparing OD Flow Prediction Performance (R²) for Feature-based Model (Population + Distance) and DGI Embeddings (Embedding + Distance) across Leeds, London, and National Datasets
Value of the Research
This work demonstrates that self-supervised graph representation learning can extract meaningful socio-economic signals from mobility data without any labelled training supervision. This has several important implications:
- Reusable representation: The embeddings learned here could serve as pre-trained zone representations for a wide range of downstream urban analytics tasks, analogous to how language model embeddings are reused across NLP tasks. The consistent performance of DGI across all three configurations strengthens the case for this approach.
- Scalability: DGI and related self-supervised methods can be applied to any geography for which OD flow data exist without requiring labelled datasets.
- Open and reproducible: The project uses entirely publicly available UK data, and the code is openly available on GitHub, making the full pipeline reproducible.
- Policy and commercial relevance: Accurate, data-driven representations of urban deprivation and mobility structure can inform evidence-based transport planning, housing policy, and public service allocation, and can be of direct relevance to organisations working with location intelligence and catchment analysis, such as Geolytix.
The work contributes to the broader theme of Geospatial Artificial Intelligence (GeoAI) and Geospatial Foundation Models. The project directly addresses how large-scale, heterogeneous mobility datasets can be transformed into reusable, interpretable spatial representations. It aligns with ongoing efforts to develop robust geospatial data infrastructure, and to operationalise foundation model concepts in the field.
Insights from the Research
- Mobility networks as socio-economic signals
Commuting flows encode aspects of how residents engage with labour markets and urban centres, which in turn reflect underlying socio-economic structures. Graph-based embeddings generally outperform POI-only features, suggesting that zone connectivity adds information about deprivation and mobility structure beyond what local amenities alone capture.
- Graph representation learning captures interaction structure
By operating directly on the OD graph, DGI learns embeddings that summarise not just local amenities but also each zone’s position within the wider commuting system. This aligns with spatial interaction theory, where the pattern of flows between places reveals functional linkages that are difficult to capture through local attributes alone.
- Mobility embeddings as reusable urban representations
The broadly consistent benefits of DGI across multiple regions and data sources suggest that mobility-derived embeddings could serve as general-purpose zone representations. They can be transferred or fine-tuned, similar to pre-trained language or vision models.
- Need for multimodal geospatial foundation models
The moderate predictive performance highlights that mobility and POIs alone do not fully explain socio-demographic outcomes. Future geospatial foundation models will need to combine mobility graphs with additional modalities such as imagery, text, and detailed socio-economic statistics to capture the full complexity of urban environments.
Team
- Damilola Ogungbemi - Data Scientist, Leeds Institute for Data Analytics
- Professor Mark Birkin – Deputy Director, Healthy and Sustainable Places Data Services
- Dr. Weiming Huang – Lecturer, School of Geography, University of Leeds
- Dr. Law Stephen – Associate Professor, Geography Department, University College London
Funder
Healthy and Sustainable Places Data Services (HASP)
Acknowledgements:
The authors are grateful for support and advice from Smart Data Research UK via the Healthy and Sustainable Places Data Service (ES/Z504336/1), and from members of the data science team at Geolytix.
References
- Bommasani, R. et al. (2021). On the opportunities and risks of foundation models. arXiv preprint. [Accessed 16 Dec. 2025].
- Google DeepMind (2025). AlphaEarth foundations helps map our planet in unprecedented detail. [online] [Accessed 16 Dec. 2025].
- Hashemi, M. and Zufle, A. (2025). From points to places: towards human mobility-driven spatiotemporal foundation models via understanding places. arXiv preprint.
- HuggingFace (2024). Prithvi-EO-1.0-100M. [online] [Accessed 16 Dec. 2025].
- Kipf, T.N. and Welling, M. (2017). Semi-supervised classification with graph convolutional networks. In: International Conference on Learning Representations (ICLR).
- Ministry of Housing, Communities and Local Government (2025). English indices of deprivation 2025. London: MHCLG.
- Office for National Statistics (2021a). Origin-Destination workplace population: journey to work (ODWP01EW). UK Census 2021. Newport: ONS.
- Office for National Statistics (2021b). Lower layer super output areas (December 2021) boundaries EW BFE. Newport: ONS.
- Simini, F., Barlacchi, G., Luca, M. and Pappalardo, L. (2021). A deep gravity model for mobility flows generation. Nature Communications, 12(1).
- Velickovic, P., Fedus, W., Hamilton, W.L., Liò, P., Bengio, Y. and Hjelm, R.D. (2019). Deep graph infomax. In: International Conference on Learning Representations (ICLR).
- Yeghikyan, G., Opolka, F.L., Nanni, M., Lepri, B. and Lio, P. (2020). Learning mobility flows from urban features with spatial interaction models and neural networks. arXiv preprint. [Accessed 16 Dec. 2025].
- Zhang, W., Han, J., Xu, Z., Ni, H., Lyu, T., Liu, H. and Xiong, H. (2024a). Towards urban general intelligence: a review and outlook of urban foundation models. arXiv preprint. Available at: [Accessed 16 Dec. 2025].
- Zhang, Y., Huang, W., Yao, Y., Gao, S., Cui, L. and Yan, Z. (2024b). Urban region representation learning with human trajectories: a multi-view approach incorporating transition, spatial, and temporal perspectives. GIScience and Remote Sensing, 61(1).
- Zhong, C., Capel, J., Bernabeu-Marin, A., Batty, M. and Ellul, C. (2025). Anonymised human location data in England for urban mobility research. Scientific Data, 12, 2040.
- Zhou, Z., Gu, Z., Qu, X., Liu, P., Liu, Z. and Yu, W. (2024). Urban mobility foundation model: a literature review and hierarchical perspective. Transportation Research Part E: Logistics and Transportation Review, 192, p.103795.