
Visualising Seasonal Variation of Environmental Impact from Food Purchases in the UK
Every time a shopper fills their basket, there is an associated carbon, land use, and water use footprint. These footprints are influenced by seasonal purchasing patterns and the relative composition of the products a consumer picks. For the first time, this project makes it possible to examine how seasonal patterns in food purchasing shape the environmental footprint of the basket, and how different foods contribute to that profile across a full calendar year.
Food purchasing is one of the most significant contributors to household environmental impact in the UK. Seasonal events, cultural occasions, and changing weather are expected to influence consumer purchasing behaviour, yet the environmental consequences of these patterns have not previously been quantified and studied at this level of temporal or categorical detail. Researchers have produced annual estimates of food system emissions, but interactive tools that allow week-by-week variation in total and category-level footprints do not exist.
This project addresses that gap. Working with anonymised daily transaction data from a Major UK supermarket retailer, the Sustainable Food Sales Explorer provides an interactive visual environment for exploring the environmental footprint of food purchasing across a full calendar year. The dashboard maps purchasing data to three established environmental metrics: Greenhouse Gas Emissions, Land Use, and Water Use. A composite score averages the three scaled metrics into a single 0 to 1 index, capturing periods how collective carbon, land, and water impacts changed across the year.
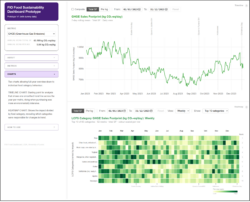
Figure 1: Sustainable Food Sales Explorer (Prototype with Dummy data)
Accessible description: Full-page view of the dashboard prototype consisting of user controls, key definitions and two charts- a) timeline chart showing the change in environmental footprint that comes from the sales of food and drink products, b) heatmap chart showing the weekly footprint values disaggregated into sets of food and drink categories that the sold products belong to. The current prototype uses dummy data which can be replaced to represent real-world sales transactions in future versions.
Two coordinated charts form the dashboard. These were built using D3.js; an open-source JavaScript library for dynamic and interactive visualisations on the web. Together they support a sequential analysis, meaning a researcher can identify a period of elevated or reduced footprint in the first chart, narrow both charts to the period of interest, and examine how category-level footprints varied across that same period. The two charts comprise:
A) A smoothed timeline chart, which shows the daily environmental footprint trend for the whole year, capturing how this footprint varies across seasons and helping to identify periods of both elevated and reduced footprint;
B) A category heatmap, which breaks the same period down across 30 consolidated food groups derived from the Office for National Statistics (ONS) Living Costs and Food Survey (LCFS) classification; a standardised set of food categories used across UK national statistics.
In addition to developing the Sustainable Food Sales Explorer, we undertook research to understand how GHGE from food and drink sales differ over the festive period around Christmas compared to the rest of the year. This has been written up for publication in an academic journal and is available as a pre-print here: https://osf.io/preprints/socarxiv/vztd2_v1.
A key analytical feature of both the dashboard and the festive analysis is the separation of total footprint from per-kilogram footprint. The total footprint reflects the environmental impact of all purchases in any period, accounting for the volume of products purchased, as well as the specific mix or composition of products purchased. The per-kilogram view tells us about the sustainability of products, if we were to keep the total weight of products purchased constant. In other words, it tells how the relative composition of products in the basket shifts. For example, the per-kilogram metric would help us identify shifts from less-sustainable (e.g. meat-based) ready meals toward more sustainable (e.g. plant-based) ready meals. The sales footprint captures the combined effect of these shifts alongside changes in the volume of products purchased (e.g. through reduced purchasing of discretionary foods, or food waste).
Data and methods
1) Data Sources:
The dashboard and festive analyses were based on two data inputs:
2022 - A) The first is anonymised daily loyalty card transaction records from a major UK grocery retailer for 2022. The records cover loyalty card holders registered to addresses in Yorkshire and the Humber, though the transactions themselves span purchases made across the UK and online.
2023 - B) The second is a database of environmental impact values per kilogram of product, sourced from Dineva et al. (2026), and based on data from Poore and Nemecek (2018). Collectively, these data provide one of the most methodologically transparent and harmonised food system life cycle databases available for food and drink items.
Environmental impact values are expressed per kilogram of product across three metrics: Greenhouse Gas Emissions in kilograms of CO₂-equivalent, Land Use in square metres multiplied by years occupied, and Water Use in litres.
2) Data Preparation:
Daily transaction records are matched to per-kilogram environmental impact values at product level. For each day and each food category, two quantities are calculated:
A) Total Sales Footprint: Calculated by multiplying the per-kilogram environmental impact value by the total weight sold across all products. It reflects the total environmental impact of purchasing on that day.
B) Per-Kilogram Sales Footprint: Calculated by dividing the total Sales Footprint by the total weight of products sold on that day. It captures changes in the relative composition of products purchased, isolating this from the impact of purchasing more/less products overall.
For the dashboard, a seven-day mean is applied to all daily values before any plotting takes place. This removes day-to-day noise and variation associated with day-of-week purchasing patterns while preserving the underlying seasonal signal and protecting commercially sensitive data. Weekly aggregations use January-01-anchored seven-day bins rather than ISO week numbering, where ISO refers to the international standard that anchors weeks to Monday and can produce partial weeks at the start and end of a calendar year. The January-01 anchoring used here ensures all 52 weekly bins are of equal length. All weekly averaged values are pre-computed in Python and stored as JSON files. The browser performs no calculations and reads pre-prepared values directly.
3) Visualisation approach:
For the dashboard, the analysis is presented through two interactive charts designed to support sequential exploration of the data. The first is a timeline showing the 7-day averaged environmental footprint for any selected metric across the full year.
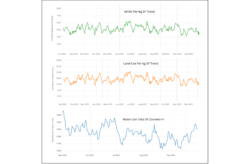
Figure 2: Timeline Chart Prototypes with Dummy Data
Accessible description: Different views from custom user selections are shown in a stacked grid. The 3 environmental metrics, GHGE, Land Use, and Water Use, can each be visualized along with the option to toggle between Total Sales Footprint and Per-Kg values; and pick custom date ranges. This flexible design helps the user perform a broad analysis of the footprint timeline while remaining in the same view. These prototypes were build using D3.js and tested on the Observable environment before being replicated for the tool.
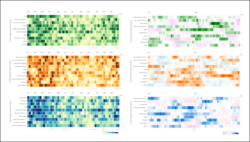 Figure 3: Heatmap Chart Prototypes with Dummy Data
Different views from custom user selections are shown in a grid. The 3 environmental metrics, GHGE, Land Use, and Water Use, can each be disaggregated into food and drink categories and visualized along with the option to toggle between Total Sales Footprint and Per-Kg values; and pick custom date ranges. The two stacks represent both the Total Sales Footprint view alongside the Per-Kg view, which would allow the user to quickly spot when certain food groups contribute the most and how much of it can be associated with a changing mix or composition of products.
The second is a category-level heatmap showing the same period broken down across 30 food groups, with one row per category and one column per week. The colour of each cell reflects how that category's footprint compares to its own typical level across the full year, rather than to other categories. This design choice allows variation within a category to be read independently of its absolute size, so a category with a low overall impact, but which experiences a large seasonal surge relative to its baseline is as visible as a structurally dominant one (i.e. surge in a high-impact category, where the absolute magnitude of that surge is much larger).
Both charts respond to their specific set of controls. Each chart can have flexible date ranges and can also be switched between a total footprint view and a per-kilogram view. Both are generated by values pre-computed in Python, ensuring the browser presents findings directly without performing any calculations at the point of interaction. A prototype using synthetic dummy data has been developed outside the Trusted Research Environment to allow tool validation and design iteration before real retailer data is connected and the dummy data are presented throughout.
For the festive analysis, we produced static time-series charts showing the daily and weekly trends of the total GHGE sales footprint across the year, with the month of December defined as the festive period. These charts compare the festive period against the remainder of the year baseline, for sales footprints and per-kilogram footprints.
Key findings
- Seasonal variation in the environmental footprint of food and drink purchasing has been confirmed and quantified at total footprint and per-kilogram level across 30 food categories and 3 environmental metrics simultaneously, using daily sales data averaged in 52 weekly bins.
- During the festive period, the total greenhouse gas sales footprint increased by 15.3% relative to the rest of the year, equivalent to approximately 3,000 return flights between London and the North Pole.
- The per-kilogram greenhouse gas footprint increased by 6.6% upon entering the festive period, indicating that shifts in the relative composition of products purchased contributed to elevated footprints alongside broader changes in purchasing activity.
- While ‘Beef’ remained relatively high in impact across the year, it showed an increase in greenhouse gas emissions during the festive period. Other key categories with increased footprints were ‘chocolate’, ‘cheese and curd’, ‘bacon and ham’, ‘lamb’, ‘cakes and puddings.’ The increased festive emissions from these categories together amounted to 160 tonnes of CO2-eq emissions, or enough to fly around the world 27 times.
Value of the research
This project links over 160 million individual product sales from more than 27 thousand unique food and drink products to per-kilogram environmental impact values across greenhouse gas emissions, land use, and water use. It provides researchers, analysts, and practitioners with an exploration tool that enables flexible, reproducible analysis across any time window, food category, or environmental metric for a novel and important dataset, as well as a reproducible pipeline can be used with data from other regions, over longer time periods and other retailers.
For the retailer partner, the tool offers a structured view of how food purchasing across their store network translates into environmental footprints at category level. It supports sustainability reporting by showing which categories and which seasonal periods are associated with higher or lower footprints and provides a basis for identifying target periods for in-store interventions.
For policymakers and retailers, our festive analysis paper showed that purchasing over the Festive Period is less healthy, and the Festive Period may represent an important opportunity for behaviour change interventions that aim to encourage shifts towards healthier and more sustainable purchases. This study shows that with more considered promotion and/or choices of food and drink purchases during the festive period, both in respect to the food itself and the volumes of food purchased, there could be sizeable benefit to people and the planet.
What our partner said...
“We are pleased to host the ‘Sustainable Food Sales Explorer’ through the Healthy and Sustainable Places Data Service. The tool draws on transaction data from a major UK supermarket retailer, covering over 160 million sales and more than 27,000 food and drink products, to show how the environmental impacts of food and drink sales vary across the year. It lets researchers explore seasonal patterns across all food and drink sales, as well as at the product category level, and should provide a basis for future research and policy action.”
- Professor Nik Lomax, Director of the Healthy and Sustainable Places Data Service
Insights
- The analysis shows for the first time, that the environmental footprint of food and drink purchasing varies meaningfully across the seasons.
- It reveals that seasonal variations are driven by a combination of changes in the volume of foods and drinks sold, and changes in the relative mix or composition of foods and drinks chosen by consumers.
- The parallel presentation of total and per-kilogram footprints within the same interface provides a reusable analytical framework that could be applied to other retailers, regions, years, and domains of food sustainability research to explore sustainable food purchasing patterns through multiple lenses.
Team
- Piyush Mohan, Leeds Institute for Data Analytics (LIDA), University of Leeds
- Dr Emma Wilkins, School of Food Science & Nutrition, University of Leeds
- Dr Alice Kininmonth, School of Food Science & Nutrition, University of Leeds
- Professor Michelle Morris, School of Food Science & Nutrition, University of Leeds
- Dr Vicki Jenneson, School of Food Science & Nutrition, University of Leeds
- Professor Alex Johnstone, School of Medicine, Medical Sciences and Nutrition, University of Aberdeen
- Professor Mark Green, Department of Geography and Planning, University of Liverpool
Partner
NDA
Funder
The research leading to these results has received funding through the Transforming the UK Food System (TUKFS) for Healthy People and a Healthy Environment SPF Programme, delivered by UKRI, in partnership with the Global Food Security Programme, BBSRC, ESRC, MRC, NERC, Defra, DHSC, OHID, Innovate UK and FSA (FIO-Food award: BB/W018021/1).
This work has been facilitated by the Leeds Institute for Data Analytics (LIDA) Data Scientist Development Programme, which employs early-career data scientists to deliver real-world data-driven impact in the interests of the public good.
References
- Poore J, Nemecek T. Reducing food’s environmental impacts through producers and consumers. Science (1979). 2018 Jun 1;360(6392):987–92. doi:10.1126/science.aaq0216 PubMed PMID: 29853680
- Office for National Statistics. Health Survey for England, 2024 [Internet]. 2026. Available from: https://digital.nhs.uk/data-and-information/publications/statistical/health-survey-for-england/2024#resources
- Crippa M, Solazzo E, Guizzardi D, Monforti-Ferrario F, Tubiello FN, Leip A. Food systems are responsible for a third of global anthropogenic GHG emissions. Nat Food. 20210308th ed. 2021;2(3):198–209. doi:10.1038/s43016-021-00225-9 PubMed PMID: 37117443
- Scheelbeek P, Green R, Papier K, Knuppel A, Alae-Carew C, Balkwill A, et al. Health impacts and environmental footprints of diets that meet the Eatwell Guide recommendations: analyses of multiple UK studies. BMJ Open. 20200826th ed. 2020;10(8):e037554. doi:10.1136/bmjopen-2020-037554 PubMed PMID: 32847945.
- Dineva M, Wilkins E, Green MA, Gilthorpe MS, Johnstone AM, Morris MA. Mapping food and drink products to environmental sustainability metrics using retail transaction data. 2026. doi:https://doi.org/10.31235/osf.io/rxf9j_v1
- Wilkins E, Dineva M, Green MA, Gilthorpe MS, Johnstone AM, Morris MA. FIO food environmental sustainability look up tool. Data asset provided by the Healthy & Sustainable Places Data Service (ES/Z504336/1). [Internet]. 2026. Available from: https://doi.org/10.82147/013 doi:https://doi.org/10.82147/013
- Wilkins E, Dineva M, Green M, Gilthorpe M, Johnstone A, Morris M. [Preprint] Environmental sustainability, healthiness and cost of supermarket retailer food and non-alcoholic beverage categories: an observational analysis of retail transaction data from Yorkshire and the Humber, UK (2022). SocArXiv [Internet]. 2026 [cited 2026 Aug 17]. Available from: osf.io/preprints/socarxiv/28puq_v1