New LASER dashboard now live

Leeds Institute for Data Analytics (LIDA) is delighted to announce that the new LASER dashboard is now live and operational.
The dashboard is a suite of Power BI reports that can help researchers monitor and manage their activity, usage and costs within LASER.
The Leeds Analytics Secure Environment for Research (LASER) is a cutting-edge cloud based (Microsoft Azure) platform hosted in LIDA, designed to empower researchers and students to drive data analytics excellence at the University.
Previously, users of LASER were able to access activity and cost data through the native Azure Portal, but the information was distributed across different pages and navigating them required an understanding of the Azure infrastructure that was not very intuitive. This resulted in the information being hidden, hard to interpret and in many cases simply unseen.
The ability to monitor activity (especially ongoing costs) is critical in managing project budgets for Azure resources. If the information on costs for these resources is hidden behind heavy navigation and unintuitive tools the task of understanding the true cost of research on LASER becomes more difficult. Not being able to monitor activity risks inflating those costs unnecessarily should resources be left running.
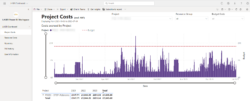
Figure 1 - Example ‘Project Costs’ report showing daily Azure costs and budget over time for a single project on LASER
Refreshed on a daily basis the new suite of data and complementary tools combine all of the useful information into a single, easy to use report where costs, activity, and configurations of Trusted Research Environments in LASER can be easily seen at a glance. The LASER Dashboard uses a native Azure Function App (with functions written by the Data Analytics Team (DAT) in LIDA) to pull all relevant data via Azure REST API. A Power BI report visualises this data from the host database using a set of carefully curated views, also created by members of the DAT.
The upgraded functionality will enable researchers to see
- how much their LASER TRE is costing
- against which account code those costs are being charged
- what each resource is costing
- what resources their TRE contains
- how long their Virtual Machines (VM) have been running for
- who can access their TRE
Adam Keeley, Data Analytics Team Manager said, “This new service for LASER ensures that researchers and Principal Investigators (PI) are enabled to take control of how they use and manage their project team’s use of LASER. Cloud computing is a new practice for many and with this Dashboard we aim to add transparency to the experience. By removing barriers to this management data users can continue to focus on all the important research that takes place on LASER with one less thing to worry about!”
Professor Roy Ruddle, Director of Research Technology at LIDA said, “Compared with its predecessor, the new dashboard is simpler, more maintainable and more effective at providing users with the answers they need to know about their LASER usage. A step-change improvement!”
The LASER Dashboard is available to all who use LASER, which itself is available to all staff and students in the university who conduct research and need a secure space to use confidential data. Users of LASER can also access technical expertise and advice through the LIDA Data Analytics Team.
Useful links
Read the LASER dashboard guide
New to LASER? Find out more about LASER
If you have any questions or feedback please do contact us at [email protected]. We'd love to hear what you think.