Integrating Administrative Data into UK Travel and Tourism Statistics

Keeping count of every passenger who enters and exits the UK is both a time and cost intensive task undertaken by the Office for National Statistics (ONS). This article explores how the ONS' survey methodology could be replaced using alterative data sources to generate the same statistics.
Project overview
This work is part of a joint project between the University of Leeds and the Office for National Statistics (ONS), with the goal of discontinuing the annual International Passenger Survey (IPS), which gathers travel and tourism statistics. Instead, the same information would be collected through alternative data sources as well as statistical and machine learning methods.
The project is in its early stages, and thus far it has identified a potential framework for replacing the IPS and forecasting international travel and tourism statistics for future years.
Data and methods
The Office for National Statistics (ONS) currently collects statistics on passengers entering and leaving the UK through surveys, most notably the International Passenger Survey (IPS) which has been in operation since 1961. This survey conducts between 700,000 and 800,000 interviews each year, providing data for a variety of government departments such as the Department of Transport, the Home Office, HM Revenue and Customs, and others. The data collected from this survey between the years 2013-2022 serves as the basis of this study. The data was downloaded from the UK Data Service website, along with Word documents explaining the variables and their respective mappings.
The data obtained from the survey contained information about the passenger such as their purpose of visit, expenditure during their trip, duration of stay, nationality, type of accommodation, towns visited, and so on. The data was originally analysed in Python, and data wrangling, such as adding and deriving new columns, dealing with missing values, and eliminating redundant columns, was done to facilitate the research. The analysis revealed patterns in the data, which informed what set of information that would be needed from admin data to support or replace estimates produced by the IPS. So, a conceptual model could be formed indicating information needed to move from survey partially or fully to admin-based statistics. The framework was initially explored through logistic regression, which was implemented in Python. Subsequently, a Random Forest (RF) model was used to construct the final version of this conceptual framework and was assessed based on its predictive capacity.
Key findings
To study the interaction of variables, a multinomial logistic regression model was built using data from 2013 to 2022 (excluding 2020 and 2021 owing to the Coronavirus pandemic). The main goal here was to predict a passenger's purpose of visit, based on relationships between IPS variables, as this information is not readily available in admin dataset explored to date. The trip objectives were classified into four categories: business or work, holiday, visiting family and friends (VFF), or education and other. The regression method was found to be ineffective due to the intricate and nonlinear relationship between the variables.
It was also observed that all classes of the trip purpose were well represented using randomised samples of the data. A Random Forest (RF) model was employed as a result. A Random Forest model consists of many decision trees, each given a randomly selected subset of the data, illustrated in Figure 1. Each tree makes a decision after receiving this data in a top-down fashion (illustrated in Figure 2). In this case, the decision is which trip purpose to assign a certain passenger. The random forest model considers the total of all these decisions to construct a single final decision.

Figure 1: The random forest model is visualised in the figure where several decision “trees” are gathered to produce one final decision at the root (top of the tree). The information flow is from bottom to top, where each tree conveys its decision to the parent tree it belongs to. All these decisions are pooled together at the topmost level.
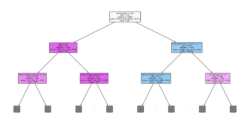
Figure 2: The random forest model is zoomed in to provide a view of the root i.e., the most important variable in the decision-making process. This variable is the most indicative out of all the other variables in predicting the output class (trip purpose) based on its value. For instance, for a particular passenger, if the accommodation type is a hotel, the tree branches out to the right, indicating that they are more likely to be on holiday. If the accommodation type is not a hotel, the tree branches out to the left, as it is likely that the person is visiting family and friends. This branching is a result of the decisions made by hundreds of trees in successive levels, and the random forest outputs one collective decision.
Examining the probabilities behind a single output prediction can reveal more information about the choice. The probabilities shed light on the likelihood of each trip purpose for a certain passenger. For example, if a passenger has a 60% chance of being on a holiday, the model will declare that this person is on a holiday as the percentage is in majority. Examining the probabilities might find that this person is 20% likely to be on business, 10% likely to be visiting family and friends and 10% likely to be in the UK for education. Summing these probabilities for all passengers provided an estimate of the total number of people visiting the UK for a particular purpose. Continuing the example, if a group of 100 passengers were all from the same country and had similar expenditure, we might be able to predict that 60 of them were on holiday, 20 on business and 10 were visiting family and friends and 10 were in the UK for education. When the model's total estimations were compared to the real data, it was found that the model estimates were very close to the real data, with the difference between the total estimates and the totals in the true data being less than a 100.
Further, these predictions were found to be stable and accurate over time, being able to forecast future statistics with reasonable accuracy. This serves as the basis for future work integrating admin data to travel and tourism estimates, informing a conceptual model of what information is needed from admin data sources. Once admin data sources have been linked, then the random forest model can be applied predicting the trip’s purpose.
Value of the research
The main goal of the travel and tourism statistics is to assess the impact of travel expenditure on the UK economy and to track developments in international tourism over time. However, relying on surveys incurs substantial costs and sometimes involves incorrect or incomplete responses that reduce the accuracy of the statistics collected. This initiative proposes a shift away from survey-based data collecting and towards non-survey sources, which promise higher-quality data. Such enhancements enable better informed decision-making and more efficient resource allocation. Furthermore, the switch to non-survey data may result in significant cost savings for the ONS, which is publicly funded.
Quote from project partner
“The international passenger survey has been the primary source of international travel and tourism statistics since its inception in the 1960s. Surveys are the gold standard of statistical data collection but can be expensive to conduct, and in many cases no longer meet the changing needs of our user groups. This project has enabled the ONS to exploit the use of admin data, whilst appreciating the role that surveys play towards the development of a full admin-based solution.
The results from this project have been instrumental in shaping the strategic direction of moving government surveys to statistics supported by admin data, addressing survey quality concerns and the potential to unlock great cost-savings when integrating admin data to travel and tourism statistics informing the UK government.”
- Dean Fletcher – Head of Travel and Tourism Statistical Development, Office for National Statistics
- Sabina Kastberg – Senior Research Officer, Office for National Statistics
Insights
- This study will be the framework for exploring alternative data sources with suitable variables for replacing the IPS.
- The ability to predict future statistics will reduce the reliance upon the IPS and will in turn be cost and timesaving for the ONS.
- A Random Forest model is robust and adept at capturing complex relationships in data and allows them to be modelled in a simple probabilistic and graphical way.
Research theme
Societies
Programme theme (select all that apply)
Statistical Data Science
People
Aditi Sudhakar, LIDA Data Scientist, University of Leeds
Dr. Ed Manley, Professor of Urban Analytics, University of Leeds
Dr. Roger Beecham, Associate Professor in Visual Data Science at School of Geography and Director of Research and Innovation at LIDA, University of Leeds
Dean Fletcher, Head of Travel and Tourism Statistical Development, Office for National Statistics
Sabina Kastberg, Senior Research Officer, Office for National Statistics
Tracy Davies, Head of Travel and Tourism Reform Project, Office for National Statistics
Partners
The Office for National Statistics (ONS)
Funders
Funded by the Office for National Statistics (ONS).