New insights into workplace and retail dynamics for England and Wales
Developing a classification of commercial and employment land use in England and Wales using location and time-series data
Project overview
Commercial areas and the businesses that inhabit them are not just an important addition to the vitality of urbanised areas but in many ways are essential to the ability of these places to flourish. This project has been utilising the newly available Whythawk dataset to construct a model for presenting and thus, understanding the spatial distributions of commercial areas across England and Wales. Largely, this has involved clustering workplaces of similar characteristics to distil a set of key workplace types, which can then subsequently be mapped and analysed. The Whythawk dataset is more detailed and up-to date than previous workplace/commercial classifications, which have been built from 2011 census data. Consequently, this could provide additional insights and novel avenues for academic research, policy initiatives and location analysis.
Data and methods
The Whythawk data contains details of commercial properties across England and Wales. It contains data such as the type of commercial property, the floor space, and employee count and business revenue. The data comes from both Valuation Office Agency and from local councils.
At the heart of our methodology is an unsupervised machine learning approach known as K-means++. Essentially, K-means++ groups variables of similar characteristics into the same cluster, to distil a specified number, K, of distinct clusters. It does this by minimising the total squared Euclidean distances between the cluster centroid and the data points within that cluster. In our case we used the percentages of floor space of each commercial type per postcode zone (e.g. LS15 8G). To add another layer of nuance to our classification and help further the distinctions between the clusters, we also generated and included an array of additional factors. These factors were selected based upon how they could impact the perceived attractiveness of an area, especially when viewed through the lens of retail and commercial attractiveness. For this we created an index of commercial diversity, rates of crime per business, as well as including measures for degree of urbanisation and accessibility by rail, road and bus.
Key findings
We produced nine distinct classification types from the k-means clustering algorithm, labelled as follows: Urban mixed commercial land use (Retail focused), Public services, Diverse Industrial and warehousing areas, Urban office spaces, Less urbanised mixed commercial land use (warehousing, retail and leisure spaces), Low diversity Industrial areas, More urbanised and diverse public services, High street retail and As yet untitled (mixed). Moreover, there was also substantial variation in distribution across the nine clusters when examining our additional variables (Crime per business, Diversity, Degree of urbanisation and Accessibility). For instance, Figures 1 and 2 below display an example of the composition of clusters 1 and 4. We can see that the clusters are distinct in their composition of commercial activity. Notably, cluster 1 demonstrates significant diversity of commercial activity, whilst incorporating a large retailing component, whereas cluster 4 has a very low diversity focusing mostly on office spaces.
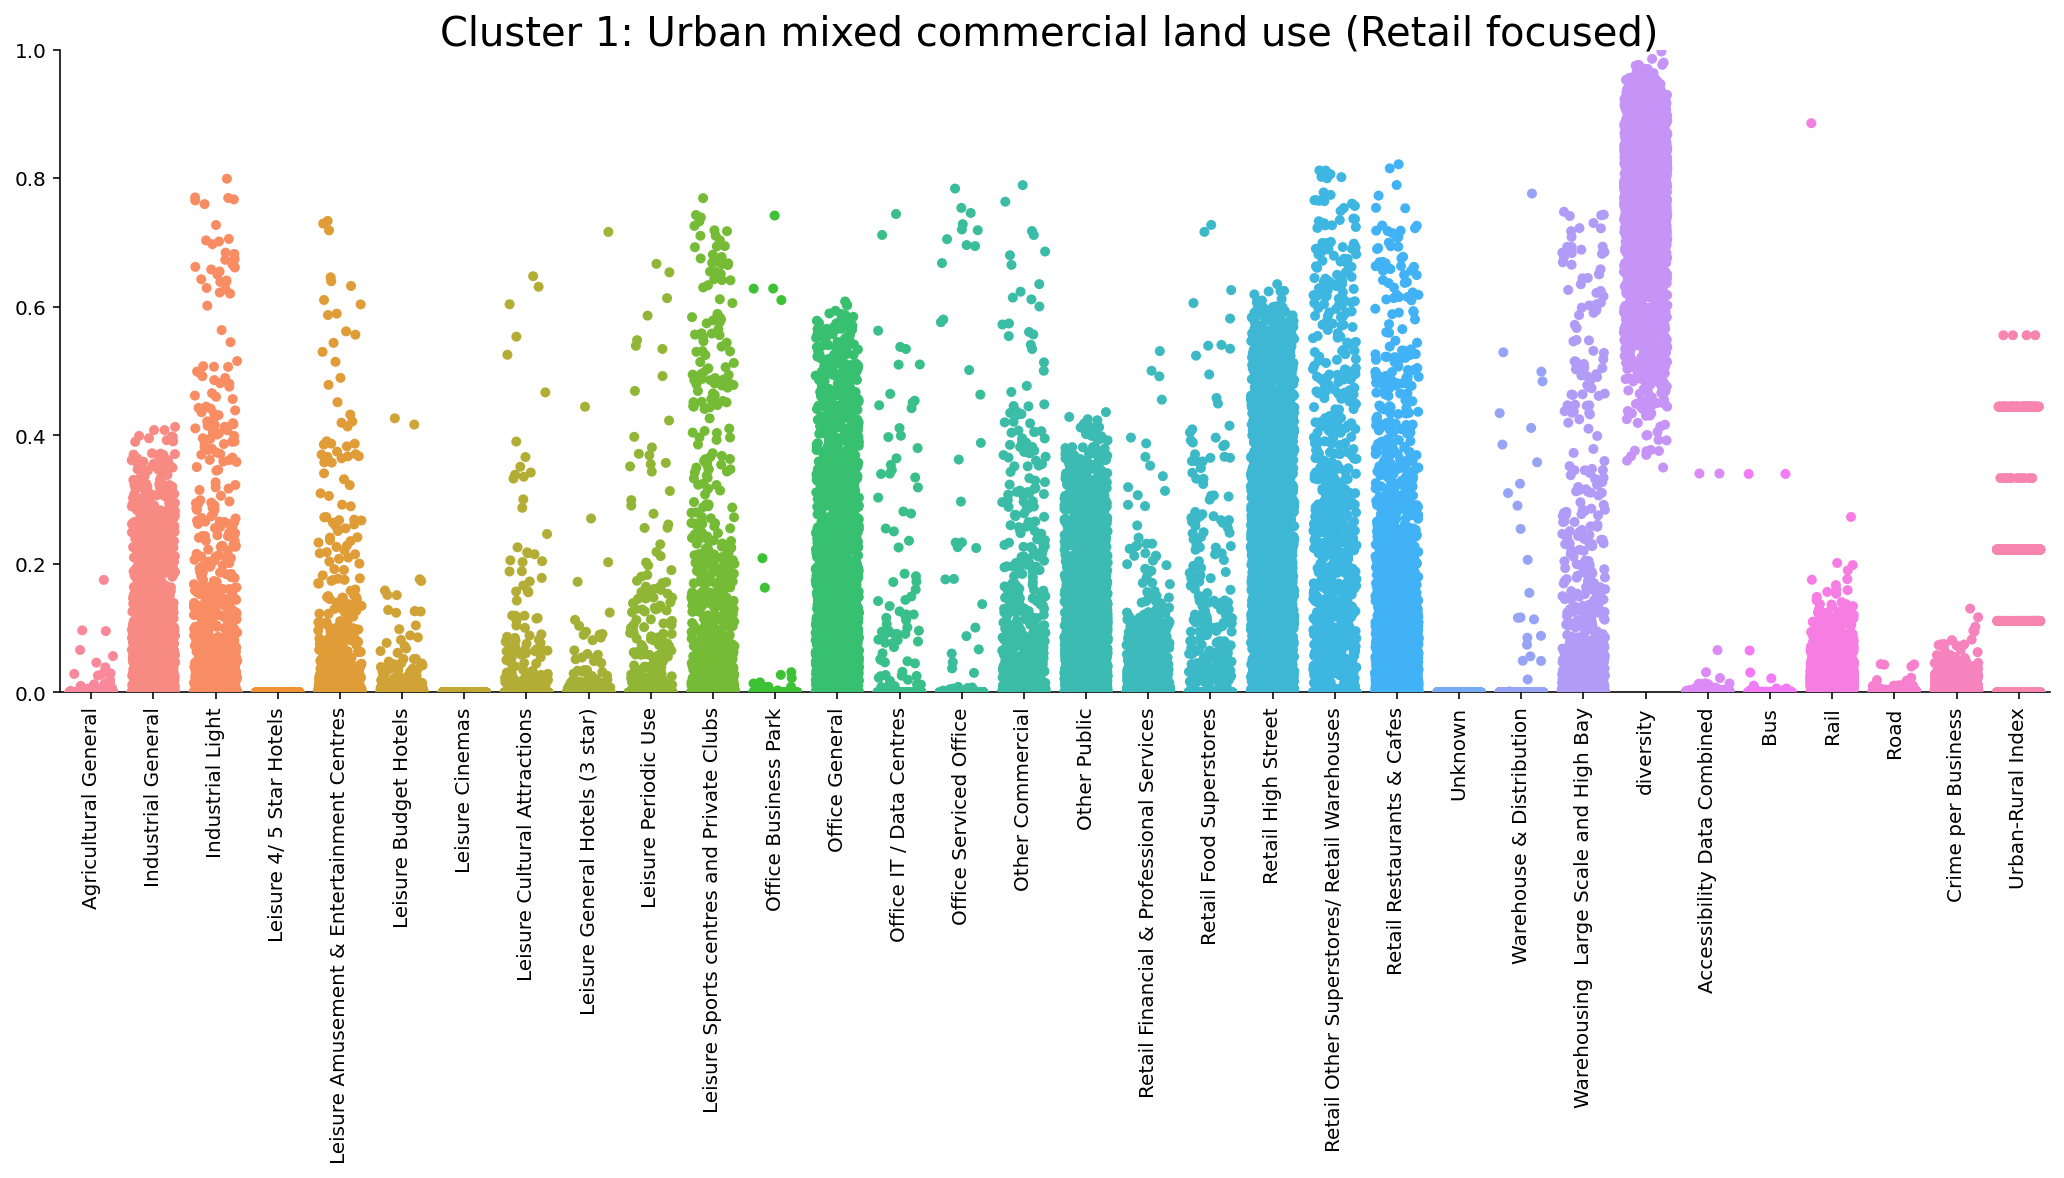
Figure 1 Catplot displaying the composition of cluster one, urban mixed commercial land use
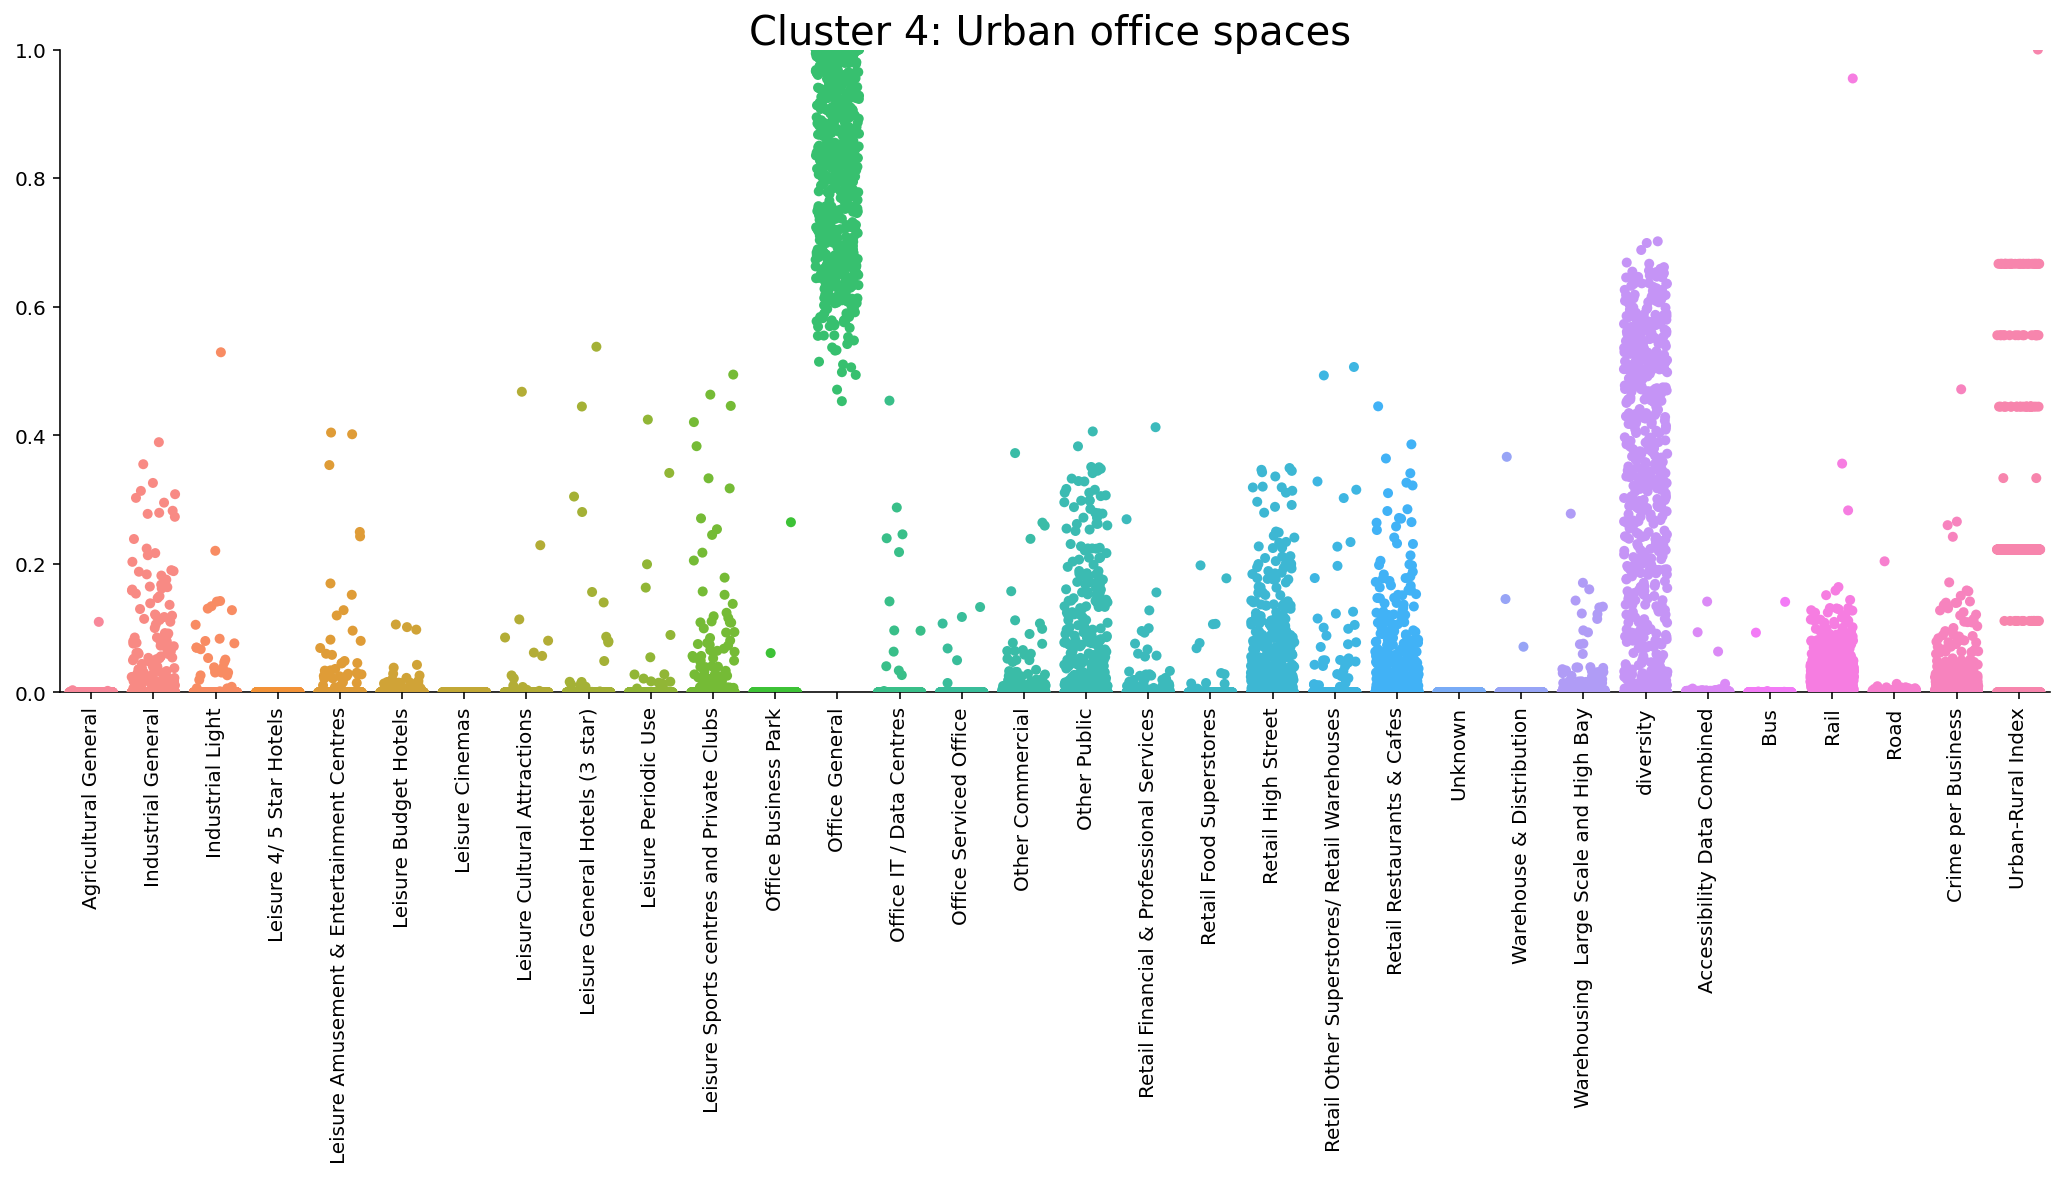
Figure 2 Catplot displaying the composition of cluster four, urban office spaces
The clusters were subsequently mapped at Unit Postcode level. All postcodes with a cumulative commercial floor space below 100m2 were removed, so that the spatial distribution and characteristics of key commercial space can be examined. Two examples of this mapping can be seen below in Figures 3 and 4.
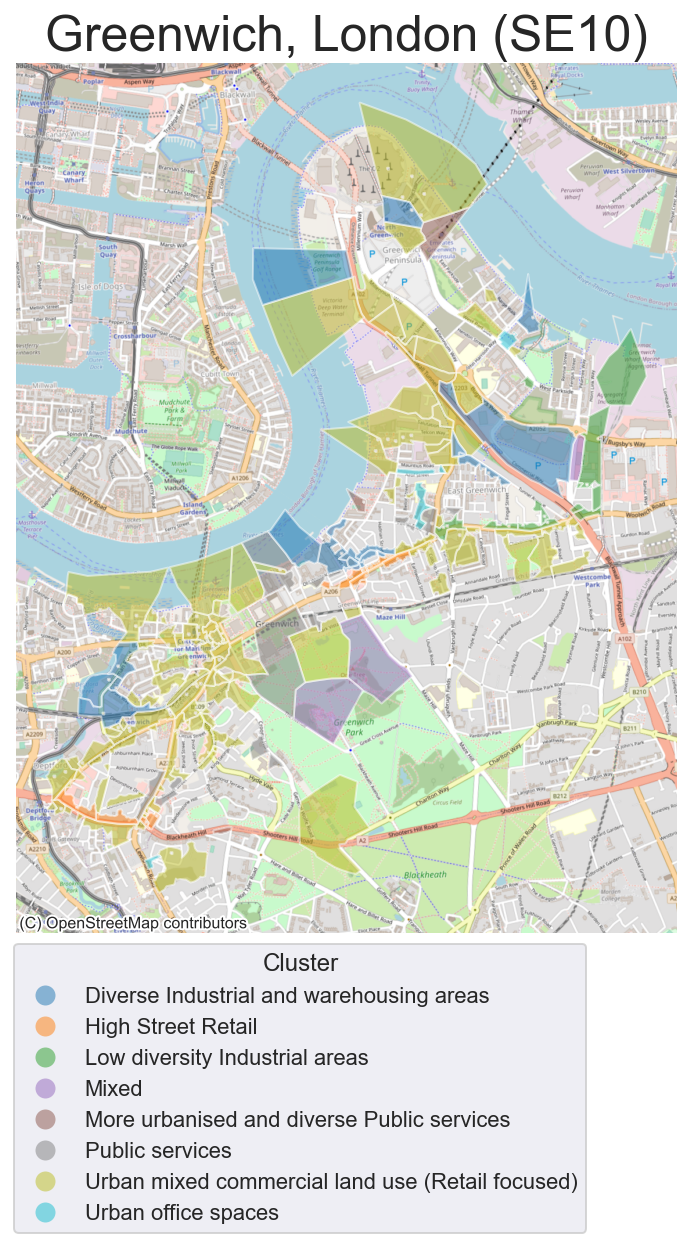
Figure 3 Map of Greenwich (SE10) in South-East London by commercial cluster type
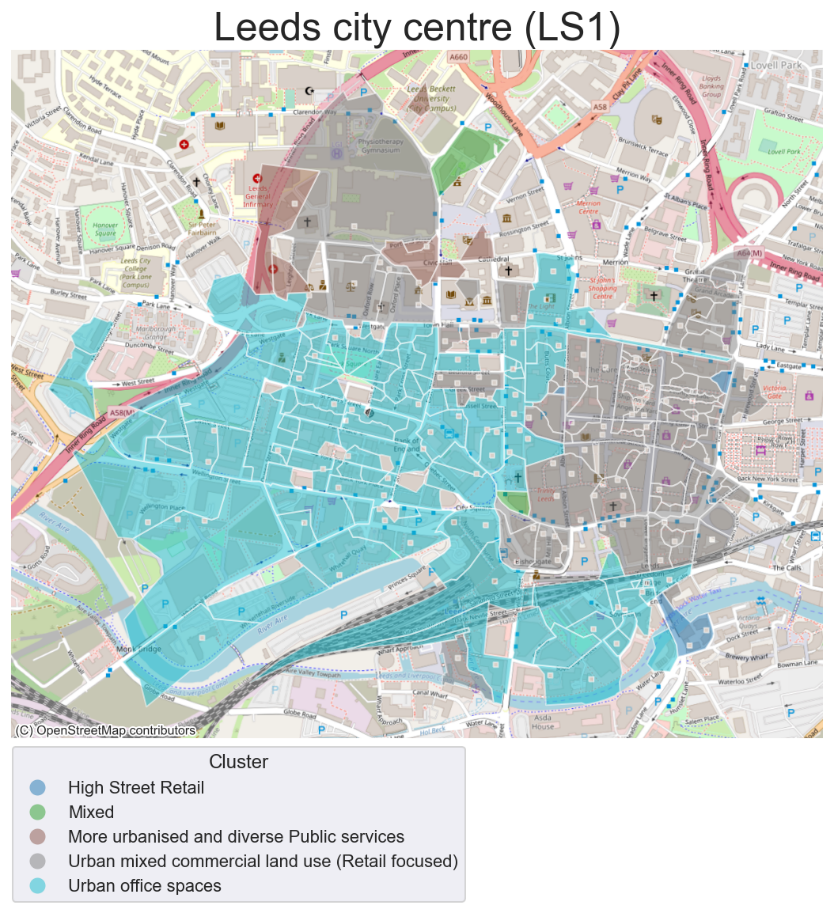
Figure 4 Map of Leeds city centre (LS1) by commercial cluster type
Lastly, this model can be combined with other data points to provide additional utility for businesses. One avenue for this is examining how business rateable and rentable values compare across the distinct cluster types. For instance, clusters 0, 2 and 4 have their mean and median rental and rateable values significantly above clusters 1, 5 and 8.
Value of the research
The results could be used by businesses to readily locate commercial areas of interest when performing tasks such as determining optimal locations for new store outlets. Additionally, this model can be used in conjunction with many other research endeavours concerning urban analytics that seek to determine the characteristics and dynamics of urban areas. For example, this may be in terms of examining workplace and neighbourhood dynamics, commuting flows as well as retail and high-street health.
Insights
- Utilising novel datasets combined with unsupervised machine learning.
- Developing a unique classification concerning commercial land use across England and Wales.
- Providing insight into urban dynamics.
Research themes
Urban Analytics
Retail and Business Analytics
People
Sebastian Heslin-Rees – Data Scientist Intern, University of Leeds
Dr Nik Lomax – Project supervisor, University of Leeds
Dr Stephen Clarke – Research fellow, University of Leeds
Dustin Foley – Data scientist, University of Leeds
Partners
Whythawk
Consumer Data Research Centre (CDRC)
Funders
Consumer Data Research Centre (CDRC)