Perceptions of Covid Safety Measures in Guest Reviews from AirDNA Data

The Hospitality sector in the UK was one of the worst hit by the pandemic with tourist accommodation hosts recording up to 20% declines in profits at the height of the pandemic. As such, the UK government introduced a hospitality strategy to revive the industry to its pre-pandemic glory. Working in line with this strategy, this project classifies hosts and properties with the aim of re-building guest confidence and increasing host compliance with policy.
Project overview
The Covid-19 pandemic brought with itself disruptions to nearly every aspect of daily life and business. The hospitality industry was one of the worst hit as portrayed by the decline in revenue seen in Figure 1 below and therefore required special attention and intervention to return to pre-pandemic figures in terms of profitability. However, one major hindrance to the effectiveness of any government intervention in the vacation rental subsector is the lack of host compliance with government policies, particularly with hosts in the short-term rental sharing economy. This project aims to among other things, increase compliance levels by utilising clustering techniques to classify properties and hosts active during the pandemic to identify patterns and behaviours that can be used in the creation of targeted, cluster specific policies and regulations.
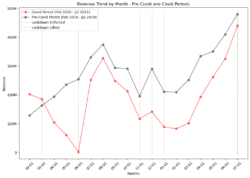
Figure 1: Revenue Trends, Pre and during pandemic periods
Data and Methods
The initial dataset consisted of over 1.3 million vacation rentals across the UK with about 526,000 corresponding host observations. The property utilization data was presented in two levels of aggregation, daily and monthly with attributes ranging from number of bookings to a host’s response rates.
To make the data suitable, data selection techniques were applied, reducing the data to about 380,000 properties and 180,000 hosts active in Great Britain during the period from the first recorded case of the pandemic on 30th January 2020 until the last day of restrictions – ‘Freedom Day’ on 19th July 2021.
Additionally, to increase analytical depth, supplementary data derived from two indicators of population and neighbourhood characteristics —the Index of Multiple Deprivation (IMD) and the Access to Health Assets and Hazards (AHAH) index—were incorporated into the dataset via geo-location at the Lower Layer Super Output Area (LSOA) level. Furthermore, a city-town classification at the same level was incorporated based on the House of Commons' 2018 City and Town classification.
The methodology used had three distinct stages: data cleaning, exploration and visualisation and clustering. In the initial phases, the data underwent thorough cleaning to ensure accuracy and consistency. Exploratory analysis techniques were employed to gain insights into the dataset's characteristics and distributions using visualizations. Prior to Clustering, Principal Components Analysis (PCA), in Figure 2 below was utilised to reduce the dimensionality of the dataset while categorical encoding methods were used to make the categorical variables present in the dataset suitable for the clustering analysis. Two Clustering algorithms were employed, K-means and K-medoids. The use of K-medoids as a second algorithm was to check the robustness of the K-means algorithm and account for any pitfalls of the K-means algorithm, particularly the sensitivity of the mean to outliers. However, as seen in Table 1 below, upon analysing the resulting clusters of both algorithms using the Davies-Bouldin Index (DBI), which is optimised by being minimised and the Calinski-Herasz Index (CHI) which is optimised by being maximised, the K-means algorithm performed the task better and so the results from the K-means clustering were adopted.
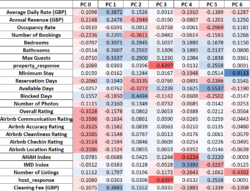
Figure 2: Caption Principal Component Loadings of Numeric Variables
| Model | DBI Score | CHI Score |
| K-Means | 1.98 | 68703.70 |
| K-Medoids | 2.06 | 43040.85 |
Table 1: Internal Validation of Clustering Results
Key findings
The distinctions between properties in rural and urban areas in terms of occupancy rates were one of the first to be noticed. Initially, as shown in Figure 3 below, occupancy rates in urban and rural areas appeared similar. Upon closer inspection however, rural areas exhibited up to 20% higher occupancy rates, offering insights into guest behaviours during the pandemic. In 2020, especially during the first lockdown, occupancy rates were low, signalling risk aversion and stricter regulations. However, in 2021, both revenue and occupancy rates increased steadily during lockdowns, suggesting heightened guest confidence. This may be indicative of individuals choosing safety-conscious vacations by booking rentals in proximity to green and blue spaces.
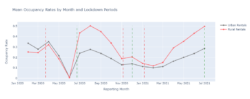
Figure 3: Urban-Rural Occupancy Rates
Following the application of the elbow method, in Figure 4 below, four distinct cluster groups were realised:
- Group 0: These properties feature hosts with poor ratings.
- Group 1: These properties are hotels and single rooms available within homes or flats.
- Group 2: This group comprises majorly of properties that were immensely popular during the period in review.
- Group 3: These were predominantly commercial rural properties.
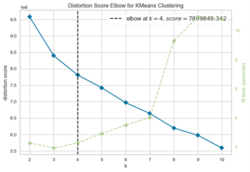
Figure 4: Elbow Plot for Optimal K
These properties and hosts are visually represented in Figure 5 and 6 below with a spatial representation of properties in Leeds provided in Figure 7.
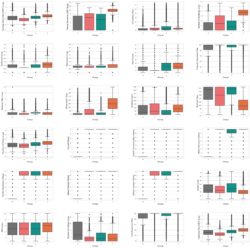
Figure 5: Inter-Cluster distinctions
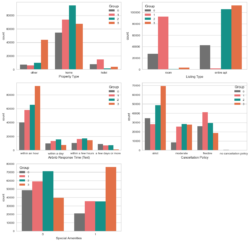
Figure 6: Inter-Cluster distinctions
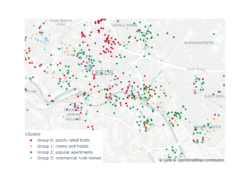
Figure 7: Spatial distribution of properties in Leeds
Value of the research
The potential impacts of the research can be seen in various areas. The research is important for policy making, for the end user and for the scientific body of knowledge. For policy, the results would contribute to increasing accommodation host adherence rates to policies and regulations. The clustering results would help increase specificity of policies and help policy makers tailor policies to clusters of hosts thereby increasing adherence. For the end user, the results of this study would bring an increase in objectivity in making choices on suitable tourist accommodation. Most of the scientific articles and research done on the subject matter of vacation rental homes and the sharing economy looks at it from the angle of the hosts or potential guests only, this study contributes to the scientific body of knowledge by bridging this gap and combining multiple perspectives and approaches to provide a robust understanding of relationships between host and property clusters and certain characteristics.
Quote from project partner
"This classification scheme ultimately adds value for hosts, guests, and local economies. It lessens uncertainty surrounding a vital component of the hospitality industry, namely safety perceptions during disease outbreaks, in a way that no single host or even group of hosts would be able to feasibly and credibly accomplish."
Bram Gallagher (Economist, AirDNA)
Insights
- The devastating effects of the pandemic left lasting impacts on the hospitality industry.
- A restorative hospitality strategy has been developed by the UK government.
- There have been issues with host compliance with generic policies and regulations.
- Targeted and specific policies for homogenous groups of hosts might be the solution.
- This study contributes to the implementation of the strategy by classifying hosts and properties into these homogeneous groups.
Research theme
- Health
- Societies
- Environment
Programme theme
- Statistical Data Science
- Data Science Infrastructures
People
Favour Aghaebe – Data Scientist, Leeds Institute for Data Analytics, University of Leeds.
Dustin Foley – Consumer Data Research Centre, Leeds Institute for Data Analytics, University of Leeds
Dr. Stephen Clark – Consumer Data Research Centre, Leeds Institute for Data Analytics, University of Leeds
Prof. Eric Atwell – Professor of Artificial Intelligence for Language, University of Leeds
Partners
AirDNA
Funders
This project was funded by the Consumer Data Research Centre (CDRC), an ESRC Data investment under project ID ES/L011891/1.