Realtime Wildfire Risk Mapping

Wildfires are recognised as an increasing risk to natural ecosystems, property, and human lives. The objective of this project was to develop an online risk mapping tool to assist West Yorkshire Fire and Rescue Service (WYFRS).
Project overview
The tool was developed using a case study covering Marsden Moor in the Peak District by employing various topographic, meteorological, and geological factors that influence wildfire spread.
Data and methods
We defined risk as the potential severity of spread if a fire starts. Wildfire spread is influenced by several topographic, meteorological and landcover factors. For example, wildfires tend to travel faster under stronger wind, uphill or when the vegetation is dry. Our objective was to build a tool that can model the effects of those factors and visualise the overall spread risk over discrete time intervals.
The data layers were obtained from multiple sources and aggregated to a 25-meter grid for cell-based computation and analysis. See Table 1 for details on the data layers used.
Table 1: Data layers included in the tool and their sources. The table shows data layers used in the tool and their respective sources. Data layers were sourced from different providers, including the Environmental Agency’s Rainfall API, the MetOffice Data Point API, UK Center for Ecology and Hydrology’s Landcover Map and EDINA Digimap for LIDAR data.
| Data Layer | Source |
| Rainfall volume | Environment Agency Rainfall API (EA, 2024) |
| Wind speed and direction temperature and humidity | MetOffice Datapoint API (MO, 2024) |
| Landcover | UK Land Cover Map (CEH, 2021) |
| Peaty soil | Peaty Soils Location (Natural England 2023) |
| Lidar Composite DTM | EDINA LIDAR (Digimap, 2023) |
We used R Shiny for the tool development and Leaflet.JS for interactive map visualisation. The tool includes two components:
- Propagation risk map to visualise the risk of fire propagation across the landscape. This was generated from a classic weighted linear combination of user-defined weights for each factor and landcover class.
- Wildfire spread map: to visualise the potential extent of fire when a user clicks on an ignition location, after having set wind direction and speed, and relative humidity. Cost Distance Analysis method was used to create an accumulated cost surface where costs represent the time required for the fire to cross the cell.
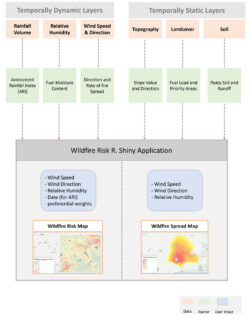
Figure 1: Overview of the tool development process. The figure demonstrates a workflow diagram which shows how each data layer was processed to represent a factor that contributes to risk of wildfire spread. It also shows the two components of the tool (a) wildfire risk map and (b) wildfire spread map.
Key findings
The tool has shown to be promising in terms of wildfire propagation risk mapping (See Figure 2). WYFRS reported that risk scores during dry seasons and with all weights set to equal values successfully highlighted the locations where large wildfires took place in the past five years.
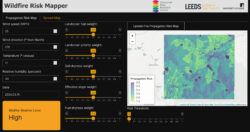
Figure 2: Snapshot of the wildfire risk map component. The snapshot shows global wildfire risk and its spatial variation across Marsden Moor Estate under the influence of 25 miles per hour westerly wind, temperature of 17 degree Celsius and relative humidity of 40 percent. It assumes equal weights for all wildfire factors.
The fire spread map showed promising results (See Figure 3). However, it requires rigorous testing against actual wildfires for calibration and improvement. Nominal rates of spread (ROS) for each landcover type under no influence of slope, wind or relative humidity were assumed based on the limited literature available. Research in the field of vegetation flammability in the UK, which has witnessed an increase recently, can enable more accurate nominal ROS inputs, therefore more accurate fire spread modelling.
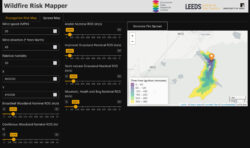
Figure 3: Snapshot of the wildfire spread mapping component. The snapshot shows the area burned hourly for the first 6 hours after a hypothetical ignition incident near Butterly Reservoir. Wind speed was set at 20 miles per hour blowing from the east, while relative humidity was set to 40 percent.
Value of the research
This project contributes to formalising the local expert understanding of wildfire risk using on a novel approach that focuses on risk of spread rather than risk of ignition. This contributes to improved resilience and preparedness against growing wildfire risk.
This tool can be used in fire mitigation and management and to assist WYFRS in identifying geospatial patterns of wildfire spread risk and to inform resource allocation. The tool can also be used by other organisations who work in the fields of wildlife conservation and physical infrastructures that is affected by wildfires.
Quote from project partner
“Wildfires can be devastating to the environment and wildlife and could ultimately put people’s lives at risk. We have witnessed an increase in wildfires in West Yorkshire, including the case study area of Marsden Moor in the past few years. Wildfire is a significant emerging risk within the UK Fire and Rescue Service, and it is anticipated to grow due to longer drier seasons and increasing summer temperatures. The wildfire mapping tool can help us anticipate wildfire spread, improve preparedness, and identify where and when to put our resources for fire mitigation and management.” Richard Hawley - T/Group Manager, West Yorkshire Fire and Rescue Service
Insights
- Wildfire risk management is a pressing challenge that needs all relevant organisations to work collaboratively. Digital mapping tools can help us identify necessary measures.
- Geo-temporal mapping tools can be utilised to provide essential insights of seasonality and spatial patterns of wildfire risk.
- Risk of ignition is important. However, it is crucial to focus on risk of fire propagation and spread as wildfires are expected to continue to increase.
Research theme
- Societies
- Environment
Programme theme (select all that apply)
- Statistical Data Science
- Visualisation Extended Reality
- Data Science Infrastructures
People
Abdelrahma Ibrahim (Hegazy) – Data Scientist, Leeds Institute for Data Analytics, University of Leeds
Alexis Comber – Professor of Spatial Data Analytics, School of Geography, University of Leeds
Steve Carver - Professor of Rewilding and Wilderness Science, School of Geography, University of Leeds
Stuart Hodkinson - Lecturer in Critical Urban Geography, School of Geography, University of Leeds
Richard Hawley - T/Group Manager, West Yorkshire Fire and Rescue Service
Partners
West Yorkshire Fire and Rescue Service
Funders
This project is part-funded by West Yorkshire Fire & Rescue Service, and part-funded by the Consumer Data Research Centre (CDRC), an ESRC Data Investment. Funding references ES/L011840/1; ES/L011891/1.