Detecting signs of volcanic unrest from space using convolutional neural networks and independent component analysis
Classifying volcanic deformation from space using a convolutional neural network
M. Gaddes, A. Hooper - COMET, School of Earth and Environment, University of Leeds, UK
F. Albino - Previously at School of Earth Sciences, University of Bristol, UK, now at ISTERRE, Université Grenoble-Alpes, France
Can computers be taught to recognise volcanic unrest simply by looking at pictures of ground deformation from space? Asking a computer to distinguish these types of behaviours simply from satellite images has its roots in the well established task of asking a computer to distinguish between photos of cats and dogs: it turns out that this is surprisingly challenging. However, recent innovations based on convolutional neural networks provide a novel approach.
Space-based measurements of ground deformation can be created from the difference between pairs of Synthetic Aperture Radar (SAR) satellite images. These measurements can be represented as a single channel (i.e. black and white) image, whose structure contains important information about the physical processes unfolding.
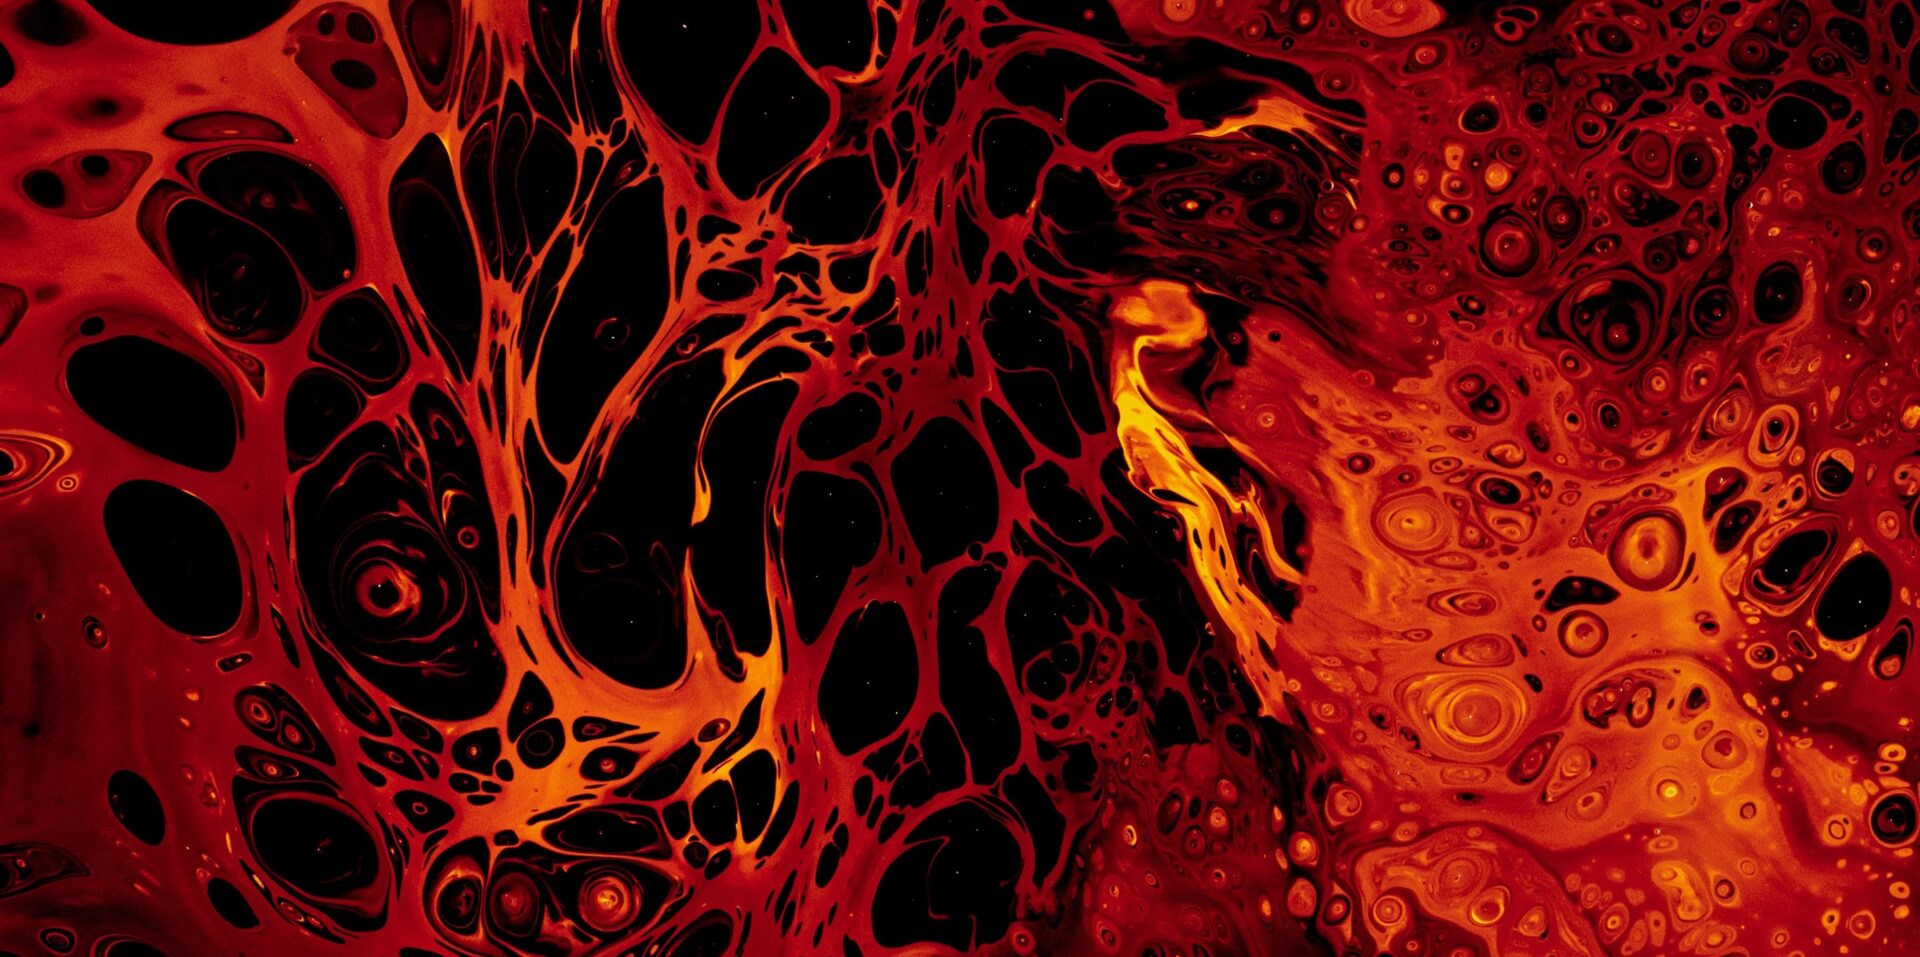
Figure 1:
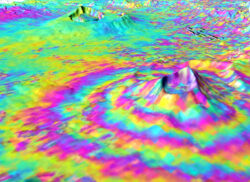
This Envisat Advanced Synthetic Aperture Radar interferogram over the Kenyan section of the Great Rift Valley shows small surface displacements that are not visible to the naked eye of the Longonot Volcano(front right). Credit: ESA, CC BY-SA 3.0 IGOCC
Over the past decade, convolutional neural networks (CNNs) have revolutionised the field of computer vision by providing a system with which computers can learn the subtle interplay of features that make up an image. This is commonly achieved by exposing a CNN to thousands to millions of images and their corresponding label (such as if the image contains a cat or a dog), and allowing the CNN to gradually learn how to map one to the other.
Satellite data
In the field of geoscience, CNNs provide an avenue for the creation of computer systems that can interpret the 2D maps of ground deformation that are produced by SAR satellites. This work is particularly exciting as the latest generation of SAR satellites acquire data over the majority of the world's volcanoes every 12 days and, as these measurements can be used to detect signs of volcanic unrest, provides a novel way to monitor many previously unmonitored volcanoes. Researchers at the Centre for the Observation and Modelling of Earthquakes, Volcanoes and Tectonics (COMET) have developed multiple CNNs to do this, and are currently in the process of automating the distribution of their model's interpretations of the latest satellite images.
The European Space Agency's Sentinel-1a satellite provides measurements of ground deformation around the majority of the world's subaerial volcanoes. These measurements span the time between two passes of the satellite over a specific volcano, which is currently around every 12 days. However, in the case that the deformation at a volcano is less than 1-2cm per 12 days, the signal is not generally visible above the noise. Previously, our CNN approach focused on cases where the deformation was visible in these short measurement intervals, but at many volcanoes this is not the case.
The machine learning approach
To address this, we have also developed a machine learning method that uses independent component analysis (ICA) and tens to hundreds of measurements in order for smaller signals to become visible above the noise. To classify different the different signals that our machine learning method returned, we then fed them into our deep learning model to determine if they are likely to be due to deformation of the ground around a volcano, or due to atmospheric nuisance signals.
Figure 2:
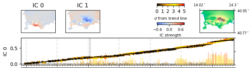
Results of the LiCSAlert monitoring algorithm for Campi Flegrei (Italy).
Using a stack of multiple measurements, our machine learning approach captures the inflation signal located at the volcano as IC0. Our deep learning CNN is able to then classify this as a a deformation signal, allowing us to focus our monitoring on it.
The line graph tracks this signal though time, with warmer colours highlighting when the inflation changes in rate. IC1 captures a typical noise signal from the atmosphere that complicates volcano monitoring at many locations, and is identified and removed by our combined machine and deep learning approach.