Analysing Connected Car Data to Understand Vehicular Route Choice
Elliot Karikari, Manon Prédhumeau, Peter Baudains, Ed Manley
University of Leeds, ESRC Consumer Data Research Centre
"From the shortest route to the most sinuous, every choice made by drivers tells a story about our driving habits and preferences. Our study of connected car data investigates this fascinating behaviour."
Project overview
This research project aims to utilize connected car data to gain insights into how route choice is influenced by various factors and how it varies over space and time. By analysing six cardinal statistical measures including travel distance, travel time, stop time, number of turns, angular deviation, and sinuosity, we aim to uncover patterns and trends in route choice behaviour. The dataset, which is made available through the ESRC Consumer Data Research Centre, comprises one month of connected car data from 50,000 vehicles, making this research unique in its scale and scope.
Data and methods
The dataset is made up of over 400 million GPS data points across the United Kingdom (UK), collected during the month of July 2022. An observation is available every 3 seconds on average during each journey. The first and last 15 seconds of each journey have been removed to anonymise start and end locations. The data contains a journey identifier, a timestamp, longitude, and latitude coordinates, as well as additional data fields for vehicle speed and bearing. There is also an associated geohash level-6 identifier for each observation. The dataset contains approximately 1.8 million vehicle journeys.
One of the major challenges in using human mobility data is the need for pre-processing (to clean), correcting data collection errors. Fortunately, no pre-processing was required as the raw data collected is highly accurate. Scikit mobility, a Python library for human mobility analysis, was used to generate travel distance and stop time metrics.
Travel Distance - This statistic measures the length of a journey
Stop Time - This statistic measures the total stop time within a journey. Places of interest, identified by long stop times, are considered pull factors in analysing route choice. Shorter stops resultant from traffic are also identified.
In addition to these two measures, we computed five additional metrics:
Travel Time – This statistic measures the duration of a journey.
Number of Turns - The number of turns along a journey is determined by the bearing change between two consecutive trajectory segments. Bearing changes greater than 50° are considered as turns (Douglas and Peucker, 1973). This statistic helps to understand the patterns regarding the routes taken, i.e., are people more likely to go along a route without many turns or not.
Cumulative Angular Deviation – The CAD measures the angularity of the trajectory.
Shortest path distance - Straight line distance between origin and destination of the journey.
Sinuosity – The statistic measures the trajectory efficiency, compared to a straight line.
Once this process was performed over the entire dataset, it was filtered to streamline results. Data covering the timespan of 4th to 31st July was selected for analysis. Round trips (trips where the shortest path distance is less than 800 metres, i.e., destination very close to the origin) were excluded from the dataset as such trips greatly skewed sinuosity results.
We utilized the Sklearn K-Means clustering algorithm to cluster the results and identify various trip types made during the specified period. Furthermore, we examined the spatial and temporal variations of these trip types to gain a more comprehensive understanding of the data.
Key findings
The clustering process used the following features: Travel Distance, Number of Turns and Sinuosity as the basis of identification of trips made. Using a combination of silhouette scores and silhouette visualizers, several values for k were tested and k=4 was selected, resulting in 4 clusters.
| Average Travelled distance | Average Number of turns | Average Sinuosity | % Trips per Cluster | |
| Clusters | ||||
| 0 | 6.98 | 11.45 | 1.56 | 78.6 |
| 1 | 22.45 | 37.20 | 1.93 | 18.9 |
| 2 | 139.10 | 42.17 | 1.40 | 2.4 |
| 3 | 48.74 | 70.13 | 31.67 | 0.1 |
The 4 clusters are the following:
Short one-way trips (Cluster 0) – Direct trips with fewest turns. Observed travel distance is averagely 56% longer than the shortest path distance;
Mid-range one-way trips (Cluster 1) – Longer trips with more turns. Observed travel distance is averagely 93% longer than shortest path distance;
Long one-way trips (Cluster 2) – Observed travel distance is averagely 40% longer than shortest path distance. Average distance travelled is 6 times longer than in Cluster 1 but has only 13% more turns. This may suggest that Cluster 2 uses more major roads.
Round trips (Cluster 3) - The clustering algorithm identified some round trips, indicating that the initial filtering process for trips that begin and end within an 800 meters radius could be improved. However, since the project is focused on one-way trips, further exploration of these round trips was not pursued.
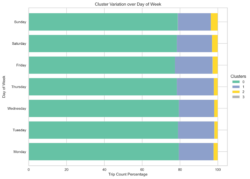
According to the data, the day of week appears to be associated with the distance of trips taken. Wednesday had the highest number of short trips, while Fridays had the highest number of mid-range trips and Sundays had the highest number of long trips. This may suggest different travel patterns and purposes. Trips on Fridays may be associated with weekend getaways or longer shopping trips while Sundays may be associated with longer trips due to travel back from weekend trips.
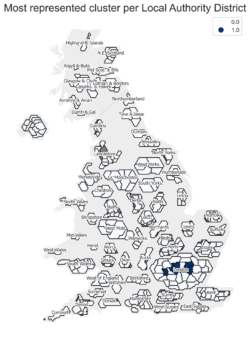
The percentage of each cluster was found per Local Authority. The most represented cluster was selected and visualised by Local Authority. The results show that short one-way trips were dominant in most areas. There were however some areas around London where Mid-range one-way trips were dominant. This could be due to the distances between residential areas and workplaces as London is a big attractor of trips.
Further investigation has been conducted by re-clustering the largest cluster (consisting of short one-way trips), to gain a deeper understanding of the variations within this grouping and how it varies across different geographical regions.
Value of the research
Connected car data is set to revolutionize the transportation industry in the UK by providing unprecedented levels of data. Big fine-scale data will enable policymakers and researchers to gain valuable insights into human behaviour, congestion patterns, and travel efficiency. By leveraging digital footprints data, policymakers can make informed decisions to improve urban infrastructure, reduce traffic congestion, and enhance the overall travel experience for citizens.
Quote from project partner
“One sentence or two approved by an industry partner or collaborator.” Include name, job title and organisation.
Wherever possible, you should try to obtain a partner quote as this will maximise the impact of your project by demonstrating its reach to a non-academic audience.
Insights
- Short one-way trips (mean 7km) are the most common type of trip made, but mid-range trips are dominant in some areas around London.
- The sinuosity of a route can provide insight into driver behaviour, with peak traffic hours showing more sinuous routes.
- Re-clustering the largest cluster of short one-way trips can provide further insight into the variation within the grouping (Short one-way trips) and its geographic distribution.
Research theme
Identify which LIDA research theme(s) this sits under:
- Societies
Programme theme (select all that apply)
- Statistical Data Science
- Mathematical and Computational Foundations
- Data Science Infrastructures
People
Elliot Karikari is a Data Scientist at the Leeds Institute for Data Analytics, University of Leeds.
Manon Prédhumeau is a Research Fellow at the School of Geography of the University of Leeds.
Peter Baudains is a Research Data Scientist at the ESRC Consumer Data Research Centre at the University of Leeds.
Ed Manley is Professor of Urban Analytics in the School of Geography, University of Leeds, and Turing Fellow at the Alan Turing Institute.
Partners
All partners involved (except where an NDA applies)
N.B. Partners should be sent a copy of the case study before it is shared on LIDA comms and be asked to approve it. An email confirming their approval should be sent to the LIDA Comms Manager and Programme Co-Ordinator.
Funders
Funded by Consumer Data Research Centre, an ESRC Data Investment, under project ID CDRC 376, ES/L011840/1; ES/L011891/1.
Images
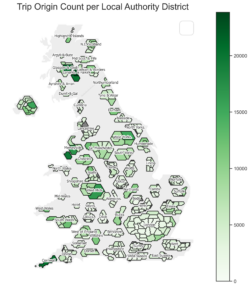
[Image 1] Description:
Geographic Visualisations were done using non-contiguous cartogram at the Local Authority level. The Local Authority District have been grouped and scaled in size relative to their populations and show the count of journeys travelled per Local Authority.
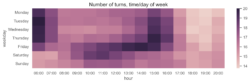
[Image 2] Description:
This figure shows the average number of turns made per trip starts by weekday and hour.
[Image 3] Description:
This figure shows the percentage of each trip type made by day of the week. Short trips dominate on all days; this calls for further investigation on Cluster 0.
[Image 4] Description:
This map shows the most represented trip type by Local Authority District. Almost all areas were dominated by Short one-way trips. Some areas around London were however dominated by Mid-range one-way trips.