Does food insecurity lead to greater health inequalities in Oxfordshire?

Modelling the spatial relationship between food insecurity risk and health outcomes in Oxfordshire could save the NHS billions from the £30 billion it is expected to spend annually on obesity and malnutrition by 2050.
Project overview
Food insecurity is a growing concern in the UK and one that around 9 million adults suffered from last June (2023). Food insecurity, which could lead to both obesity and malnutrition, is also a major driver of health inequalities and a risk factor for severe health outcomes (diabetes, hypertension, stroke, heart disease, and several cancers). By investigating the spatial association between food insecurity risk and health outcomes in Oxfordshire, this research empowers Good Food Oxfordshire (GFO) to support and promote a healthy, sustainable, and fair food system in areas where its absence is exhausting NHS resources the most.
Data and methods
The research combined qualitative insights from the project's external partner, Good Food Oxfordshire (GFO), with quantitative data on food insecurity risk and various health outcomes to pinpoint areas where supporting the food system could most reduce health inequalities.
Food insecurity risk was measured using the Consumer Data Research Centre's (CDRC) Priority Places for Food Index (PPFI) - a composite index combining LSOA-level data from seven dimensions covering deprivation and barriers to food purchase. A Lower Super Output Area (LSOA) is a geographic hierarchy and area, commonly used to report Census results, that is formed of 400-1,200 households and has a population of 1000-3,000 persons.
Health data was collected from multiple sources and covered the prevalence of child obesity and Type 2 diabetes as well as emergency admissions for cardiovascular diseases and conditions (stroke, heart attack, and coronary heart disease).
Research outputs include a Power BI dashboard intended for policy- and decision-makers within GFO's network and simultaneously visualizing PPFI and health data.
The other output is a publication intended for researchers (for transparency and reproducibility) that presents and analyses the outputs of Geographically Weighted Regression (GWR) models. The GWR model is a statistical and spatial technique that computes LSOA-specific regression coefficients that estimate the relationship between the prevalence of a health outcome (e.g., Type 2 Diabetes) and each of the PPFI’s seven dimensions (i.e., food insecurity risk factors). Analysing the magnitude and spatial distribution of the statistically significant coefficients enables GFO to pinpoint areas where tackling specific food insecurity risk factors (e.g., the PPFI dimensions such as income deprivation, fuel poverty, family food support, or barriers to food purchase) could contribute the most towards reducing health inequalities.
Key findings
The GWR models examining the spatial relationship between the PPFI dimensions and each of child obesity (at the reception year and year six) and Type 2 diabetes provided insights into which food insecurity risk factors could be driving the prevalence of child obesity throughout the childhood years and potentially exacerbating the risks of Type 2 Diabetes.
The comparison between the GWR models for child obesity (at both ages) revealed that tackling income deprivation in eight LSOAs (see Figure 1) in Blackbird Leys and Greater Leys (which are among the 20% most deprived in England) could reduce child obesity prevalence rates at both ages as well as the prevalence of Type 2 Diabetes. The latter could suggest that deprivation has been affecting the population in these areas for a long time and that the high prevalence of child obesity is likely building up the risk of a Type 2 diabetes diagnosis years later. Each decile increase (i.e., reduction in food insecurity risk from income deprivation) in the socio-demographics dimension of the PPFI is estimated to reduce reception year and year six child obesity prevalence rates by up to 0.7% (from 11-12%) and 1.8% (from 24-27%), respectively. At the same time, each decile shift in the same PPFI dimension is expected to reduce the prevalence of Type 2 Diabetes by 0.2-0.4% (from around 6%).
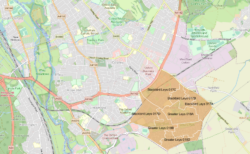
Figure 1. Map of Areas in Blackbird Leys & Greater Leys (created using Esri ArcGIS maps in Power BI)
Along the same lines, designing policies and taking action to make energy more affordable, accessible, and efficient in Barton, Churchill, and Sandhills (also areas among the 20% most deprived in England) could significantly reduce reception and year six child obesity (see Figure 2 for a map of these areas). Each decile increase (or reduction in food insecurity risk from fuel poverty) is estimated to reduce reception year and year six child obesity prevalence rates by up to 0.9% (from 9-11%) and 1.7% (from 16-24%).

Figure 2. Map of Areas in Barton, Churchill, and Sandhills (created using Esri ArcGIS maps in Power BI)
Reinforcing the family food support schemes to meet the increasing demand for them in multiple areas across Oxford, as well as parts of South Oxfordshire and Vale of White Horse districts (refer to Figures 3 & 4), could impact the child obesity prevalence rates, particularly at year six. Some of these areas (in Churchill, Iffley, Littlemore, and Rosehill) are among England's 20% most deprived. Each decile increase in the Family Food Support dimension (or reduction in the food insecurity risk driven by the high demand for food support) is associated with a reduction in reception year and year six child obesity prevalence rates by up to 1.8% (from 3-11%) and 3.6% (from 10-28%), respectively.
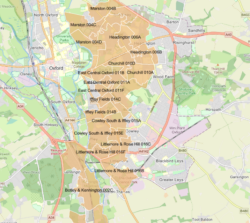
Figure 3. Map of Areas in Oxford, South Oxfordshire, and Vale of White Horse Districts (created using Esri ArcGIS maps in Power BI)
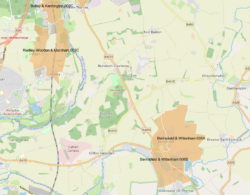
Figure 4. Map of Areas in Oxford, South Oxfordshire, and Vale of White Horse Districts - Continued (created using Esri ArcGIS maps in Power BI)
Furthermore, the estimates from the GWR for Type 2 Diabetes indicated that better access to food support schemes (such as the Healthy Start Voucher scheme) and food banks could reduce the prevalence of Type 2 Diabetes by 0.3-0.4% (from 3-5%). The latter is particularly true in Churchill 010D, Cowley North 019A, and East Central Oxford 011C LSOAs (see Figure 5).

Figure 5. Map of Areas in Churchill, Cowley North, and East Central Oxford. (created using Esri ArcGIS maps in Power BI)
Value of the research
This research's Power BI dashboard is an accessible, intuitive, and responsive tool that empowers policy- and decision-makers to identify Oxfordshire areas where food insecurity could aggravate health inequalities.
Policymakers in GFO's network will use these insights to make strategic decisions on where to focus their efforts on supporting the food system whilst prioritising specific levers (i.e., addressing the most salient food insecurity risk factors) characteristic of each area to improve health outcomes and reduce the prevalence of specific health conditions such as child obesity and Type 2 Diabetes.
The publication presents and analyses the outputs of GWR models and complements the dashboard by studying the spatial relationship from a statistical significance perspective. The regression analysis identifies Oxfordshire areas where tackling specific food insecurity risk factors could improve health outcomes for both children (over the short term by reducing obesity prevalence rates) and adults (over the long term by reducing the prevalence of Type 2 diabetes). Moreover, the publication is a valuable research output as it enables other researchers to apply the methodology to other areas in the UK or abroad.
Quote from project partner
“The PPFI in general, and this research in particular, are really useful for us in help setting priorities and metrics for the Oxfordshire Food Strategy, which has local plans for each District. PPFI is a key metric, and the dashboard provides an easy-to-access, easy-to-explain visualisation for discussion with expert and non-expert alike.”
Fiona Steel, Manager, Good Food Oxfordshire
Insights
- Tackling income deprivation in Blackbird Leys and Greater Leys (among the 20% most deprived areas in England) could significantly reduce the prevalence of child obesity (by 0.7% at the reception year and 1.8% at year six) and Type 2 diabetes (by 1.6-1.7%), with each decile shift in the socio-demographic barriers PPFI dimension.
- Initiatives to make energy more accessible, affordable, and efficient for the population in Barton, Churchill, and Sandhills (whose areas are among the 20% most deprived in England) could significantly reduce child obesity at the reception year (by up to 0.9%) and year six (by up to 1.7%), with each decile shift in the fuel poverty PPFI dimension.
- The reinforcement of family food support schemes in Churchill, Iffley, Littlemore, and Rosehill (whose areas are among the 20% most deprived in England) is expected to reduce the prevalence of child obesity (by 1.8% at the reception year and 3.6% at year six) and diabetes (to a lesser extent—by 0.3-0.4%).
Research theme
Health and Societies
Programme theme
Statistical Data Science
People
Ahmad Ammash, Data Scientist, Leeds Institute for Data Analytics, University of Leeds
Dr Francesca Pontin, Senior Research Data Scientist, Consumer Data Research Centre, University of Leeds
Dr Emily Ennis, Research Impact Manager, Consumer Data Research Centre, University of Leeds
Alexander Hambley, Research Software Engineer, Consumer Data Research Centre, University of Leeds
Fiona Steel, Manager, Good Food Oxfordshire
Stuart Newstead, Director, Good Food Oxfordshire
Partners
Good Food Oxfordshire (GFO)
Funders
Consumer Data Research Centre (CDRC)