Measuring motion-to-photon latency for sensorimotor experiments with virtual reality systems
This research studied how virtual reality (VR) systems work when people use them for various activities. VR systems can be used for research, but we need to make sure they are reliable for scientific experiments. One important thing to check is the delay between when a person moves in the real world and when that movement is shown in the virtual world on the VR headset screen. This delay can affect how well people can use VR.
In the past, scientists used special software and equipment to measure this delay, but it only gave them one number for the delay and didn't consider how the VR system predicts movements. This made it hard to trust the results for different VR systems.
The researchers created a novel method to measure this delay that works with any VR system. They used high-speed cameras to compare the real movements with what the VR system showed. They tested popular VR systems like HTC Vive, Oculus Rift, Oculus Rift S, and Valve Index, while using a game engine called Unity and SteamVR.
When a user starts moving suddenly in VR, all the headsets had delays ranging from 21 to 42 milliseconds. However, once the VR system learned how the person moves, the delay was reduced to 2–13 milliseconds. This reduction happened within about 25 to 58 milliseconds of starting to move.
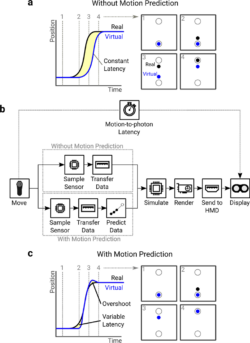
Fig. 1
From: Measuring motion-to-photon latency for sensorimotor experiments with virtual reality systems
a Latency represented as a temporal difference between a real movement and its virtual visualization. The effect of latency is shown in a reaching task, where the virtual movement lags behind the real one. b The pipeline of operations a position sample goes through to be presented to the user. Each step along the pipeline has its own latency, and the sum of these operations gives the motion-to-photon latency of the system. Motion prediction can be used to predict where the controller will be when the frame is presented to the user, functionally reducing latency. c Once a movement can be predicted reliably, the virtual movement can match the real one. The effect of this is shown in a reaching task, where the initial portion of the movement is still delayed but once motion can be predicted, the virtual movement matches the real one. The end of the movement may be similarly affected, with the virtual motion overshooting motion offset due to the deceleration.
The study found that when there are sudden and fast movements in VR, like starting to move, hitting something, or changing direction quickly, it can increase the delay and make the VR less accurate. The new measurement technique helps researchers understand these factors and how they affect their experiments before they collect data using VR systems.
These delays can matter for some research and tasks in VR. Some experiments may not be affected by these delays, while others might be. So, it's essential for researchers to understand and report these delays to ensure they don't affect their results.
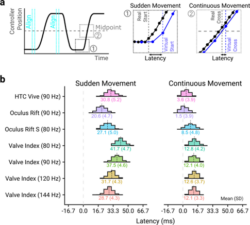
a The latency at the start (Sudden) and middle (Continuous) of the movement was measured. Note that the real controller positions were sampled every camera frame, whereas virtual controller positions could only be sampled every HMD frame. b Histograms of the measured latency for the different HMDs in the Sudden Movement (left panel) and Continuous Movement (right panel) conditions. The mean and standard deviation for each HMD and frame rate combination is shown beneath the histogram. The histogram bin widths were 4.17 ms, to match the camera frame rate, centered on a latency of 0 ms. Some of the variability present in the measurements is due to the stochasticity between the event occurring (the movement onset or the mid-point crossing), and when the camera captures a new frame or the HMD displays a new frame, as illustrated in Figure S2 in supplementary materials
The program used to interface with the VR systems was run on a desktop PC with the Windows 10 operating system. The computer specifications were an AMD Ryzen 2600X CPU, 32 GB DDR4 RAM, and Nvidia GTX 1060 GPU (driver version 457.09), meeting at least the minimum specification for all HMDs tested.
The latency of four VR systems was assessed: HTC Vive (1080 x 1200px per eye, 90 Hz), Oculus Rift CV1 (1080 x 1200px per eye, 90-Hz refresh rate), Oculus Rift S (1280 x 1440px per eye, 80 Hz), and Valve Index (1440 × 1600px per eye, 80 Hz/90 Hz/120 Hz/144 Hz). As the Valve Index features four different frame rates, in total seven VR setups were tested. These headsets were chosen as they are flagship systems from the most popular manufacturers of VR HMDs and dominate the share of devices used for gaming (Lang, 2020).