Non-household water use benchmarking

By Tamara Garcia del Toro
Water stress in the UK requires greater efficiency in water use. In the non-household sector, a water use dashboard can help customers understand their consumption and enables water companies to target conservation guidance on atypically high users. Working towards this dashboard vision this project analysed water use by business type and explored methods of identifying high users within sectors.
Project overview
This project was a collaboration between the Market Operator Services Limited (MOSL) who regulate the non-household water market in England and Wales, and Yorkshire Water. The aims were to:
- develop further knowledge of water use statistical distributions by customer characteristics to support the goal of NHH customer segmentation;
- recommend steps to support the benchmarking ambition where required (e.g. re harmonisation of data sets from different wholesalers; data volumes needed; external data sets needed); and
- recommend a standard definition of a leak (deviation from base, minimum duration) to provide an industry standard definition for use in smart meter (SM) analysis (secondary objective).
This was a continuation project which started with former DSDP James Hulse were he identified 6 business activities which are responsible for over 50% of UK non-household water demand. Focussing on these sectors we seek to identify water use ‘norms’ to allow individual customers to benchmark their consumption.
Data and methods
For this project, we sought to understand water usage in the top 6 business activities (defined by Standard Industrial Classification) with the highest water consumption. These are Agriculture and horticulture, Chemical manufacture, Food, beverage and tobacco manufacture, Hospitality and catering, Education and Human healthcare activities.
For individual customers in these sectors MOSLs provided access to annual water use data for every customer in England and Wales. This data is held in the MOSL CMOS all market database, which includes the UPRN number, and identifiers created by the OS to uniquely identify everyone property in the country. We sought to use the UPRN to link to external public datasets that could be used to differentiate customers by activity characteristics. Insufficient wider uptake of UPRN meant that individual level linking of water use and activity descriptors was not feasible, hence we conducted statistical analysis to compare, for specific sectors (and in some cases matching data geographically), water use distributions to activity distributions that were likely drivers of water use (e.g., company turnover, employment, school size). This draws on an assumption that water use, and activity rates are correlated, and hence benchmarks and so atypical users (statistical outliers) can be identified.
We did not conduct any analysis of smart meter data, as this was not forthcoming until the final weeks of the project.
Key findings
During the span of this project, we became aware of data shortcomings, including lack of reliability in water usage data. We were not able to use smart meter water data due to administrative delays and instead we worked towards developing a pipeline for future analysis of the water data using smart meter data.
During this process we have been able to:
- Find national level business counts of size as employment and turnover.
- Describe a data linkage process to join water usage and business characteristics data.
- Make recommendations for enhanced data cleaning.
- Develop a school size metric as example for dashboard development.
We were able to develop and describe a methodology for geographical data linkage which will be useful in working around the lack of UPRN identified business size data.
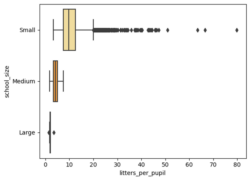
Boxplots showing the distribution of water usage within each school size group: the median water usage per pupil is significantly different for each group meaning this metric could be used for comparative purposes
Value of the research
Water conservation efforts are important in ensuring a responsible and efficient use of water resources. Better understanding of how different business activities utilise water improves understanding of where these efforts are best focused and where strategies might need to be adapted. The research has identified several barriers to benchmarking non-household water use, and suggested steps required to overcome them, so that benchmarks can be identified, and a customer facing water use dashboard can be developed.
Quote from project partner
“The resilience of water supply for customers in both household and non-household segments has become an increasing focus over the last few years. The Regulator, Ofwat and government bodies, such as Defra and the Environment Agency, are now calling for action to be taken to address these challenges and to ultimately reduce water consumption across the entire customer base. Tamara has been tenacious in her efforts to build on the great work already carried out through LIDA, she’s worked hard to overcome data issues and ultimately deliver recommendations which will help the industry evolve and adapt through effective data utilisation and sectoral comparison to meet these challenges”
Mitchell Yeoman-Boldry, Market Integration and Improvement Manager, Yorkshire Water LTD
Insights
- Water usage data, as has been collected traditionally, has a lack of accuracy in estimating usage, and smart meter data will be very useful in solving this issue.
- There seem to be significant differences in consumption per pupil in schools and school
- UPRN identified business data is not yet widely available, but geographical matching can be used for future efforts.
- Lack of strong correlations between water usage and size might be due to leakage hiding significant signals.
Research theme
- Societies
Programme theme (select all that apply)
Statistical data science, Data science infrastructures
People
Tamara Garcia del Toro, Data Scientist, University of Leeds
Dr Gordon Mitchell, Associate Professor, School of Geography, University of Leeds
Dr Andy Newing, Associate Professor, School of Geography, University of Leeds
Mitchell Yeoman-Boldry, Market integrations and improvement manager, Yorkshire water
Partners
Market Operator Services Ltd (MOSL)
Yorkshire Water Services Ltd
Funders
Funded by MOSL and the Leeds Institute for Data Analytics (LIDA) with added support from Yorkshire Water Services Ltd.