WatPop: Inferring dwelling occupancy patterns and identifying tourist dwellings using high temporal resolution water metering data
Dwelling-level water consumption data are a useful tool to identify tourist dwellings and to infer their occupancy patterns, with tremendous potential as a timely indicator of tourism activity
Project overview
This 6-month research project is linked to a larger ongoing research project ‘WatPop: Understanding seasonal population change’, working with South West Water (SWW) to explore the wider-reuse value of their water-supply data in capturing seasonal population fluctuations driven by tourism. This study draws upon a small sample of high temporal resolution water consumption data at a dwelling level (akin to the data typically collected by smart meters in this sector). Data-driven approaches are used to assess the feasibility of extracting indicators of dwelling type and occupancy from these data. Specifically, we seek to distinguish tourist dwellings (self-catering holiday lets) from residential dwellings and infer their occupancy patterns using only their metered water consumption.
Data and methods
Dwelling-level water consumption data were provided by SWW, the regional statutory water authority for the South West of England. Following pre-processing and cleaning of the raw data, including detection and correction for leakage, this study utilised data for a sample of 61 dwellings, each recorded at a 15-minute resolution over a one year period (pre-Covid). Local intelligence suggested that four of these properties operated as self-catering tourist lets available for short-term rental. We sought to develop methods which could distinguish these tourist properties from the residential housing stock, based only on their recorded consumption, and to identify data-driven methods to infer their occupancy status (occupied/unoccupied) at any given time.
We utilised unsupervised machine learning to distinguish tourist properties from residential properties, drawing on data-driven features which capture water consumption behaviour including the occupancy ratio (defined by an occupancy detection method, see below), the average water consumption, the variation in the daily water consumption, the seasonality of water usage and the difference between weekday and weekend water consumption. A number of occupancy detection methods were trialled, each of which defined occupancy on a day-by-day basis, based on whether a range of water consumption indicators fell above a specific threshold. These were assessed for accuracy in relation to manually labelled validation data, capturing inferred occupancy on a property-by-property and day-by-day basis, with the optimum approach outlined below.
The project team has worked closely with collaborators at SWW and the Office for National Statistics (ONS) throughout the research project to ensure that methods deployed (especially re: data cleaning and leak detection) reflect industry best practice, and to shape the project findings and insight for maximum impact. A follow on 6-month research project scheduled to begin in October 2022 will develop these analyses further, drawing on a larger sample of dwellings and additional ONS end-user needs.
Key findings
The most accurate method to infer property-level occupancy defined a property as occupied on a given day when both the daily mean consumption and the daily number of usage events (defined as non-zero readings) are greater than 25% of the average of each criteria over the yearlong measurement period. This method produced an average accuracy of 98.8%, meaning that only 18 days (from a total of 1460 days within our study period) were assigned an incorrect occupancy status. Figure 1 shows the daily total water consumption for a tourist property within our data, with the occupancy status, as determined by the occupancy detection method, indicated by blue bars.
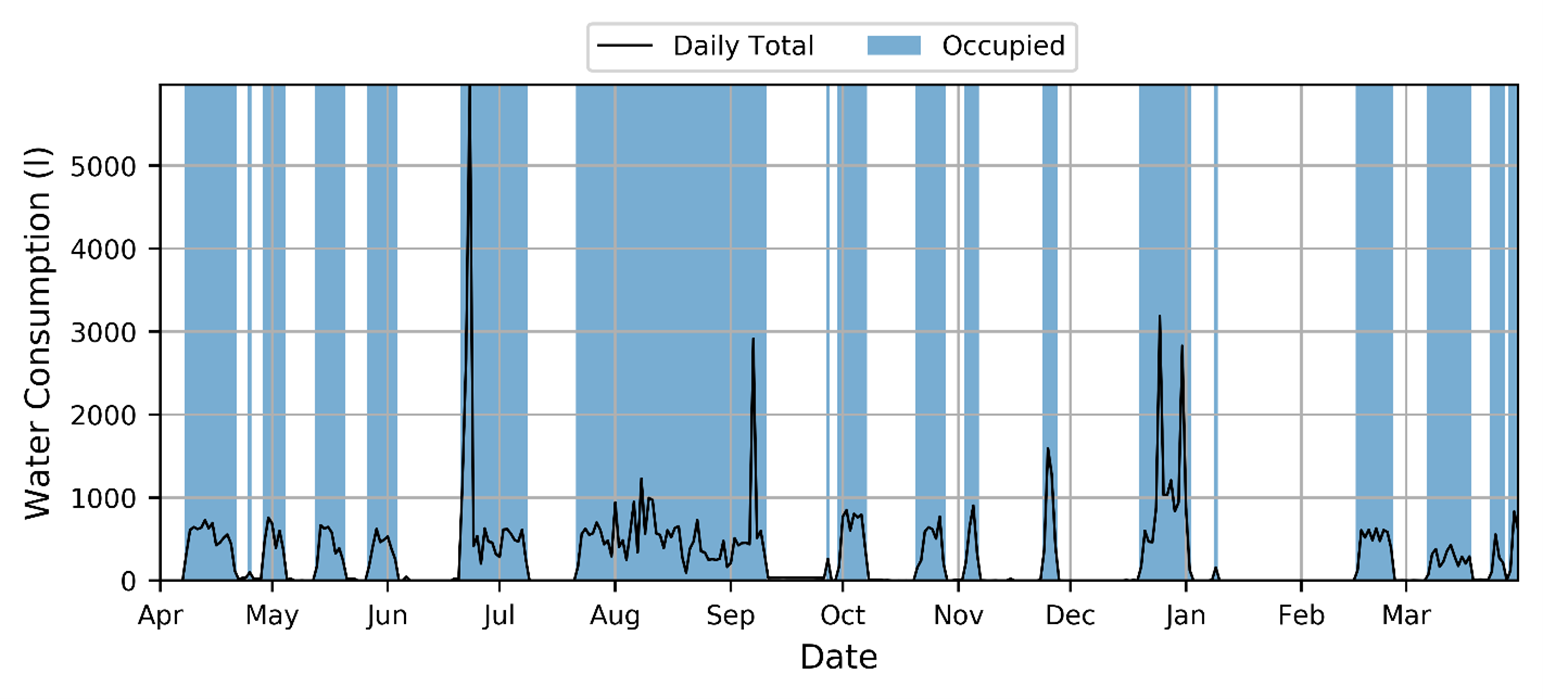
Figure 1 – Daily total water consumption for a tourist property with the occupancy status, as determined by the occupancy detection method, indicated.
A number of clustering approaches were investigated in conjunction with different combinations of features which were extracted from the water consumption data. k-means clustering provided the most accurate results and it was found that with features of occupancy ratio, the standard deviation of daily water consumption and the seasonality of water usage, the k-means algorithm distinguished tourist properties from residential properties with 100% accuracy. These results are displayed in Figure 2.
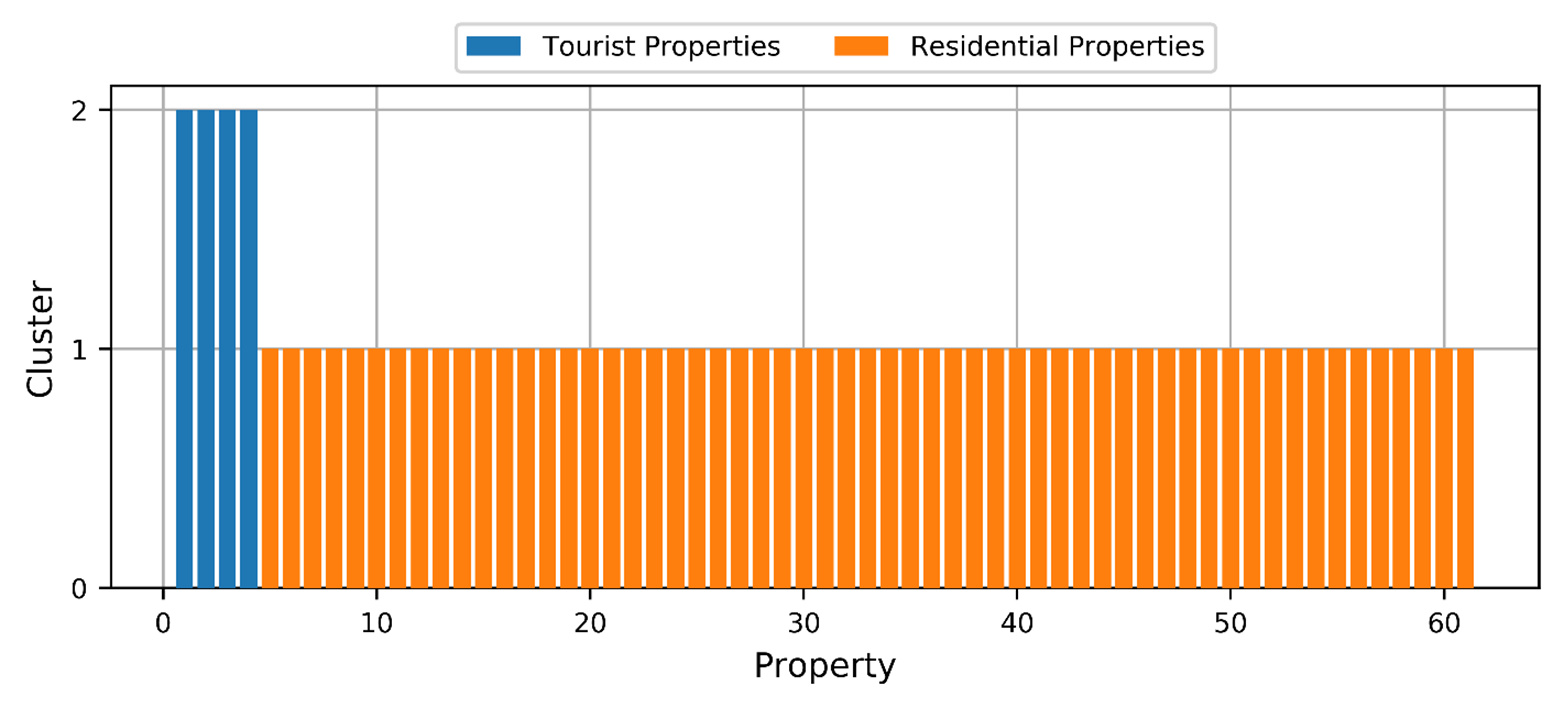
Figure 2 – k-means clustering results using the occupancy ratio, the standard deviation and the seasonality, illustrating that this approach can successfully distinguish our four tourist properties from the remaining 57 residential dwellings.
Value of the Research
Our findings suggest that it is feasible to infer dwelling type (tourist accommodation vs. residential dwelling) and occupancy status (occupied or vacant) utilising metrics derived from dwelling-level water consumption profiles. Whilst data processing challenges (including identification of leakage and the need to account for missing data) should not be underestimated, these insights could afford considerable wider-reuse value for water consumption data collected by water suppliers.
Ongoing smart meter roll out in this sector is giving rise to ever-growing volumes of high temporal resolution dwelling-level water consumption data. These data are typically held by a single supplier covering a geographical region and could therefore offer considerable potential in understanding the distribution and occupancy of tourist dwellings at a small-area level, typically underrepresented within official statistics.
Wider collaboration with the ONS Methodology Division has helped shape this work, with findings reported in a technical report prepared for ONS, capturing the potential value of these data for their work in relation to population mobility, neighbourhood classification and novel sources of data.
This 6-month research project has helped us to understand the added value within our data. It has presented an exciting opportunity to work with the ONS to explore indicators of dwelling type and dwelling-level occupancy patterns that can be extracted from our data. I have been impressed by the data-driven insights that Jacob and the project team have been able to extract from this small sample of data and look forward to developing this work further via the follow-on 6-month research project
Paul Merchant, Supply Demand Manager at South West Water
Insights
- High temporal resolution, dwelling level “smart” water meter data can be used to infer occupancy patterns for tourist lets.
- Features extracted from smart water meter data can be used to distinguish between residential and tourist properties, in this case, using k-means clustering.
Research themes
- Urban Analytics
- Statistical and mathematical methods
People
Jacob van Alwon – Data Scientist, Leeds Institute for Data Analytics
Andy Newing – Associate Professor in Applied Spatial Analysis, University of Leeds
Alan Smith – Lecturer in Environmental Management, University of Plymouth
Stuart Ellaway – Post-doctoral Research Assistant, South West Water
Paul Merchant – Supply Demand Manager, South West Water
Partners
- South West Water
- Office for National Statistics – Methodology Division
Funder
This research was funded by the Economic and Social Science Research Council’s (ESRC) Secondary Data Analysis Initiative (ES\T005904/1 – ‘WatPop: understanding seasonal population change’)